Bookmap Review 2026: Seeing the Market’s Hidden Matrix
In the world of day trading and scalping, information is everything. While 95% of retail traders stare at traditional candlestick charts and lagging indicators, professional traders and algorithmic firms focus on order flow and market liquidity. Candlesticks only tell you what happened in the past; they do not show you why it happened or who is waiting to execute.
Bookmap is not just another charting software; it is a high-performance data visualization platform that provides an X-ray view into the order book. By visualizing liquidity as a heatmap, Bookmap bridges the gap between raw market data and actionable trading insights.
Over the past month, we extensively tested Bookmap across Crypto and Futures markets, connecting it to live data feeds to see if it truly provides the edge it claims. Here is our in-depth, hands-on review.
Quick verdict
Rating: 4.8 / 5
An indispensable tool for serious scalpers and day traders. Once you learn to read the heatmap, traditional charts will feel blind in comparison.
Experienced day traders, futures/crypto scalpers, and anyone whose strategy relies heavily on reading the tape and order flow.
Free (Digital) tier available for Crypto. Paid tiers (Global/Global+) start at $49/mo to $99/mo, plus external data feed costs.
1. What is Bookmap?
Bookmap is a cutting-edge trading platform that specializes in visualizing market liquidity and the order book (Level II data). Unlike standard trading platforms that plot historical prices using bar or candlestick charts, Bookmap plots a continuous heatmap of resting limit orders and actual executed market orders.
The platform was originally designed by algorithmic high-frequency traders who needed a visual way to monitor the “microstructure” of the market. Today, it serves retail day traders, proprietary trading firms, and institutional investors who need to observe order flow at up to 40 frames per second, decoding the true supply and demand dynamics driving price movements.
Bookmap Interface: Liquidity Heatmap and Volume Bubbles
By the numbers: 40 frames per second refresh rate - Nanosecond level precision - Connects to 20+ brokerages and data feeds - Free tier for crypto markets
2. Who should use Bookmap?
Bookmap is a great fit if you are:
-
A Day Trader or Scalper -> Why it works: Scalping relies on immediate market reactions. Bookmap allows you to see exact exhaustion points and liquidity walls, providing high-probability entry and exit signals.
-
An Order Flow or Volume Trader -> Why it works: If you currently trade using the DOM (Depth of Market) or Footprint charts, Bookmap takes that raw data and visualizes it historically, making it drastically easier to process.
-
A Crypto Trader looking for an edge -> Why it works: Crypto markets are highly driven by liquidity hunting and large algorithmic orders. Bookmap’s free Digital tier connects directly to Binance and Coinbase, letting you spot these manipulations.
Bookmap may not be the right choice if you:
- Are a long-term swing trader or investor - Bookmap focuses on intraday micro-movements. If you hold positions for weeks or months based on fundamentals, this tool is unnecessary overkill.
- Trade on a very tight budget - While crypto data is free, trading futures or equities requires expensive monthly Level II data subscriptions (e.g., dxFeed or Rithmic) on top of the Bookmap subscription.
- Prefer trading on a mobile device - Bookmap is a resource-intensive desktop application designed for multiple monitors. It does not have a functional mobile trading app.
Bookmap is designed for dedicated multi-monitor desktop setups
3. Key features breakdown
3.1 The Liquidity Heatmap
This is Bookmap’s flagship feature. The platform plots the order book continuously over time. Brighter colors (like white or bright red) indicate massive concentrations of resting limit orders, while darker colors (blue or black) indicate low liquidity.
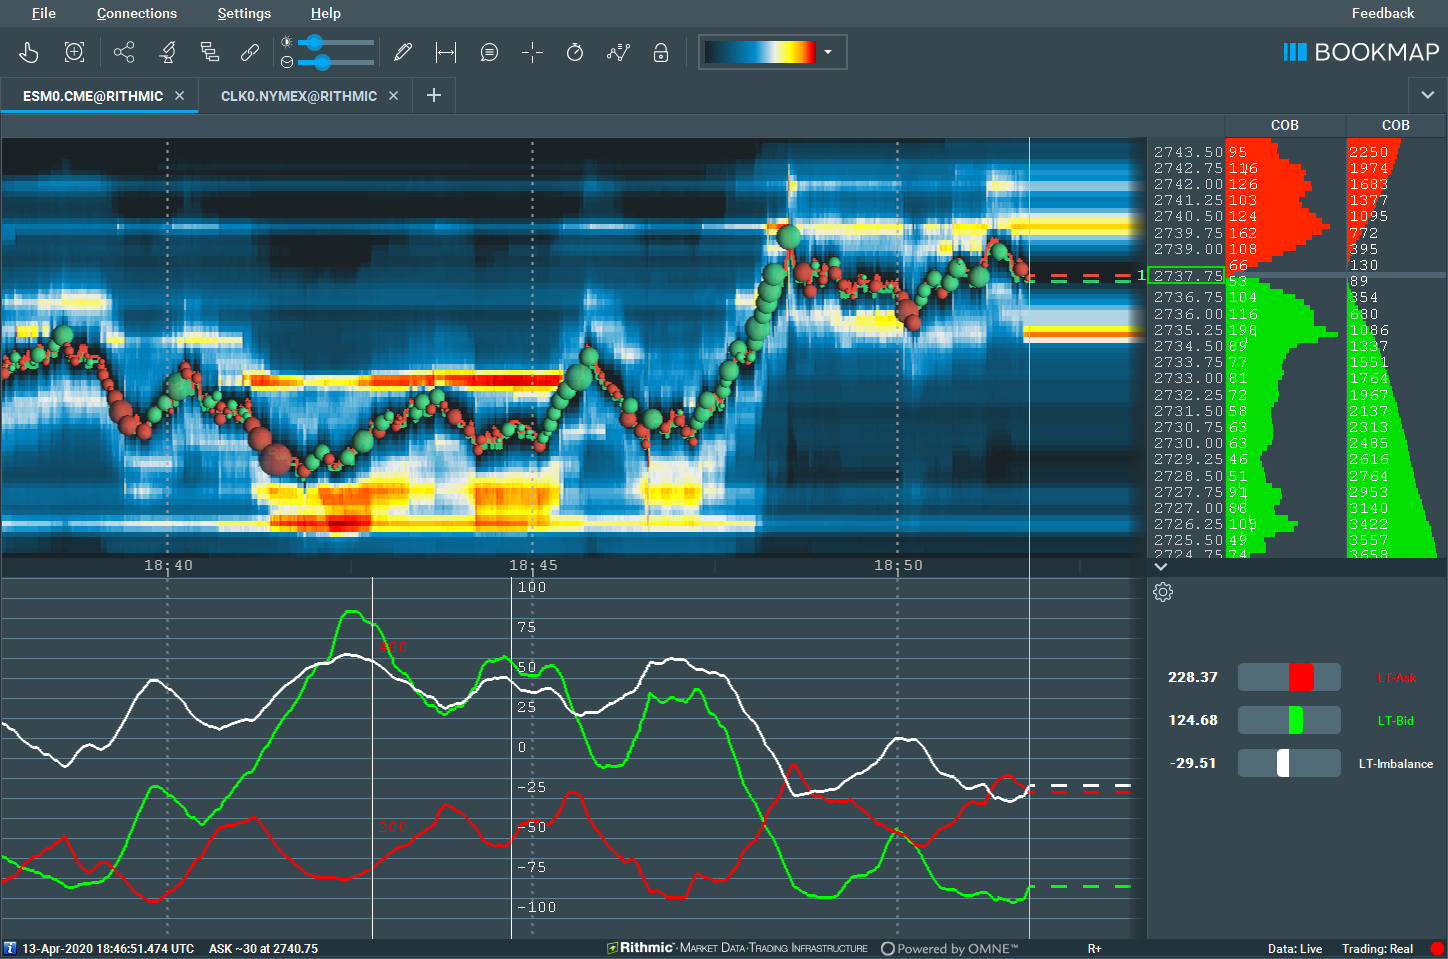
Spotting thick liquidity walls before the price arrives
During our testing, the heatmap allowed us to see literal walls of support and resistance before the price arrived there. We were able to easily spot “spoofing”-where large algorithmic players place massive fake orders to manipulate the price, only to pull them right before execution. Standard charts completely hide this activity.
3.2 Volume Bubbles
Instead of a standard volume bar at the bottom of the screen, Bookmap uses circles (bubbles) plotted directly on the chart exactly where the trades occurred. The size of the bubble represents the volume of the executed trade. Green indicates aggressive market buyers lifting the offer, while Red indicates aggressive market sellers hitting the bid.
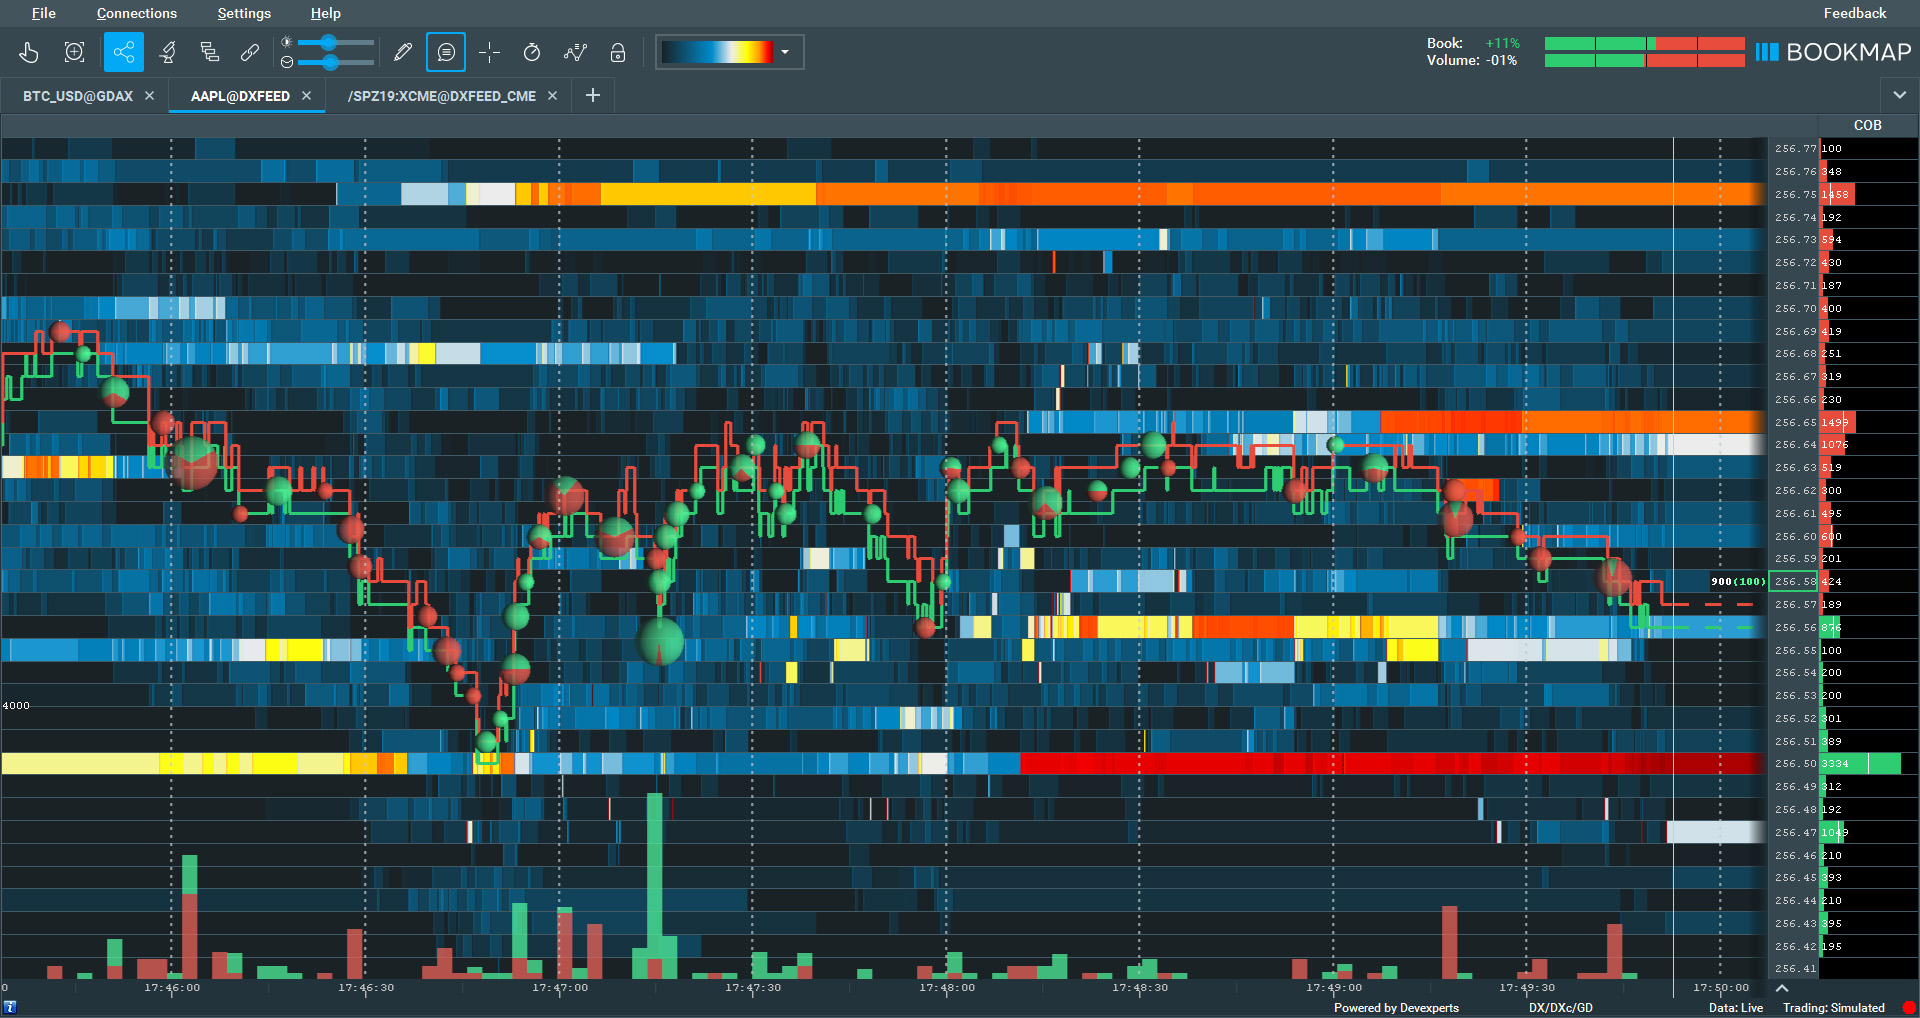
Volume Bubbles display exact aggressive market execution points
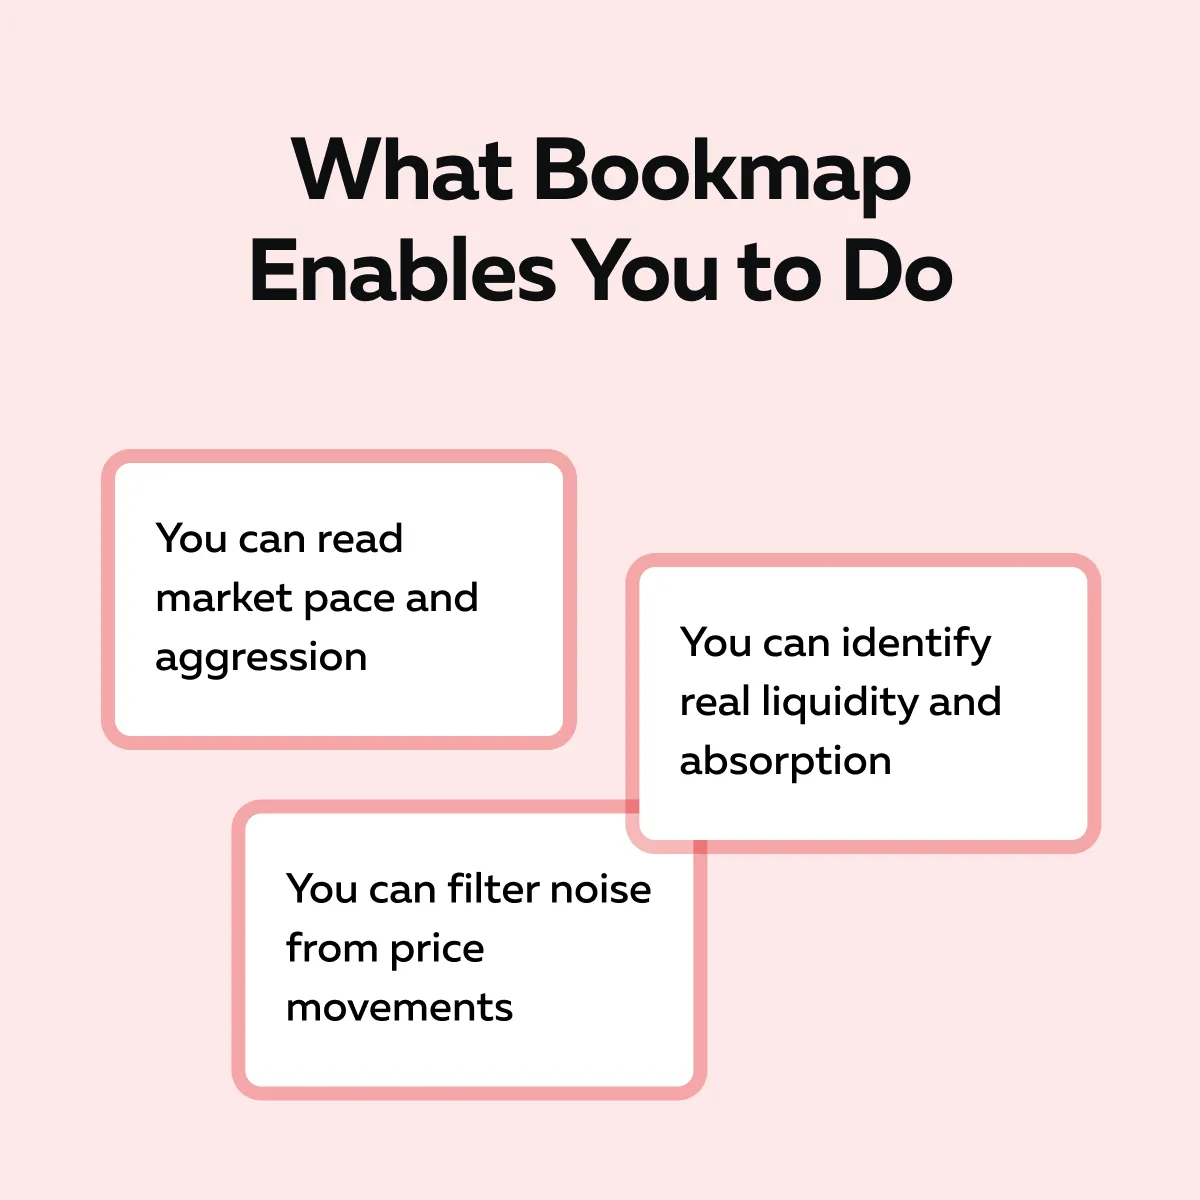
Combining Volume Bubbles with the Heatmap is where the magic happens. You can visibly watch aggressive buyers (huge green bubbles) smash into a thick liquidity wall (a bright line on the heatmap) and fail to break through. That visual absorption is the perfect short entry signal.
3.3 Nanosecond Precision & Replay Mode
Bookmap processes data incredibly fast and allows you to zoom into the chart down to the nanosecond level. Even more impressively, the platform features a Replay Mode that allows you to record live market sessions and replay them later.
We found this to be the ultimate educational tool. You can pause the market, zoom in to see exactly how an order block was filled within a millisecond, and then replay that specific event to train your eyes to recognize the pattern in real-time.
4. User experience and interface
Trader Experience (UX): We won’t sugarcoat it: opening Bookmap for the first time feels like looking at the Matrix code. The interface is visually overwhelming, dark, and vastly different from TradingView or MetaTrader. Expect to spend at least 1-2 weeks simply watching the charts in Replay Mode before executing a live trade.
Customization: Once you overcome the initial learning curve, Bookmap is highly customizable. You can adjust the color scales of the heatmap, filter out small volume bubbles to only see institutional trades, and install third-party add-ons to display VWAP, cumulative delta, and correlation trackers.
Hardware Demands: Bookmap is heavy. Visualizing thousands of data points at 40 FPS requires a robust computer. We experienced slight lagging on an older laptop with 8GB of RAM, but it ran flawlessly on a modern desktop with 32GB of RAM and a dedicated GPU.
Honest frustrations:
- Setting up the initial data connections (especially for futures brokers like NinjaTrader or Rithmic) can be technically tedious and requires careful adherence to their setup guides.
- The user interface, while functional, feels slightly dated and utilitarian compared to modern web-based charting platforms.
5. Customer support and reliability
Support channels: Bookmap provides support via email and a very active community forum. They also maintain a dedicated Discord server where traders share chart setups and help troubleshoot connection issues.
Education: This is where Bookmap shines. Because their software is complex, they invest heavily in education. They host daily live trading sessions on YouTube, provide an extensive knowledge base, and offer free courses on reading order flow.
Reliability: The software itself is highly stable. However, the reliability of the data you see is entirely dependent on your data provider. If your broker’s API drops a packet, your Bookmap chart will reflect that gap. Fortunately, Bookmap includes data diagnostic tools to help you verify feed integrity.
6. Pricing and plans
Bookmap offers a tiered subscription model. It is important to note that market data fees are not included for traditional markets and must be purchased separately.
| Tier | Monthly Price | Details |
|---|---|---|
| Digital | Free | Limited features. Connects to Crypto exchanges (Binance, Coinbase). Great for beginners. |
| Digital+ | $19 / month | Advanced tools for Crypto traders, plus delayed data for stocks/futures. |
| Global | $49 / month | Required for live Futures and Stocks trading. Allows connections to major brokerages. |
| Global+ | $99 / month | Unlocks advanced institutional add-ons, custom indicators, and multiple instrument viewing. |
Note: Lifetime licenses are also available for Global ($990) and Global Plus ($1,990).
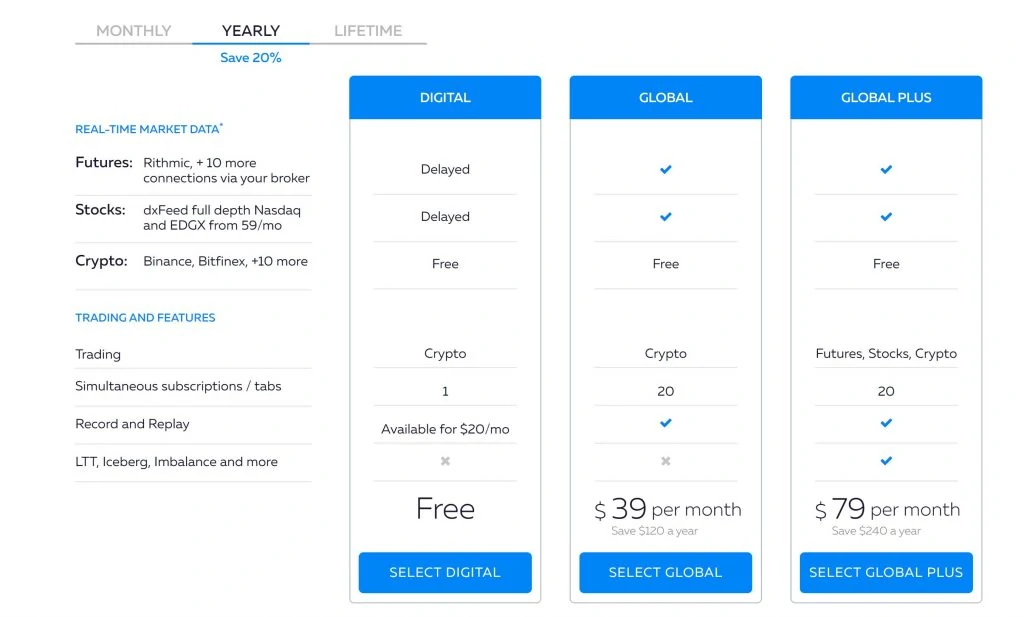
Bookmap Subscription Tiers
Best value pick: Start with the Digital (Free) tier connected to a crypto exchange. Crypto markets have deep order books that are perfect for learning how to read the heatmap. Once you are consistently profitable and understand the tool, upgrade to the Global tier for Futures trading.
7. Pros and cons
What Bookmap does well
- Unmatched Market Transparency: Provides visual insights into order flow and liquidity that standard candlestick charts simply cannot show.
- Spoofing Detection: Easily identify fake institutional limit orders used to manipulate retail traders.
- Replay Capabilities: The ability to record and replay sessions is invaluable for backtesting order flow strategies without risking real capital.
- Crypto Access: The free tier for cryptocurrency traders is exceptionally generous.
Where Bookmap falls short
- Steep Learning Curve: It takes significant screen time to learn how to interpret the heatmap accurately.
- Expensive for Futures/Equities: The combined cost of the Global+ subscription and a premium Level II data feed can easily exceed $150/month.
- Resource Intensive: Requires a relatively powerful computer to run smoothly, especially when tracking multiple highly-liquid assets simultaneously.
- No Mobile Support: Purely a desktop application.
8. How Bookmap compares to competitors
Bookmap vs Traditional Candlestick Charts
| Criteria | Bookmap | Candlestick Charts (e.g., TradingView) |
|---|---|---|
| Focus | Microstructure & Liquidity | Historical Price & Patterns |
| Visualizes Intent | Yes (Resting Limit Orders) | No |
| Best For | Scalping, Day Trading | Swing Trading, Technical Analysis |
| Learning Curve | Very Steep | Beginner Friendly |
| Cost | High (Software + Data Feeds) | Low to Free |
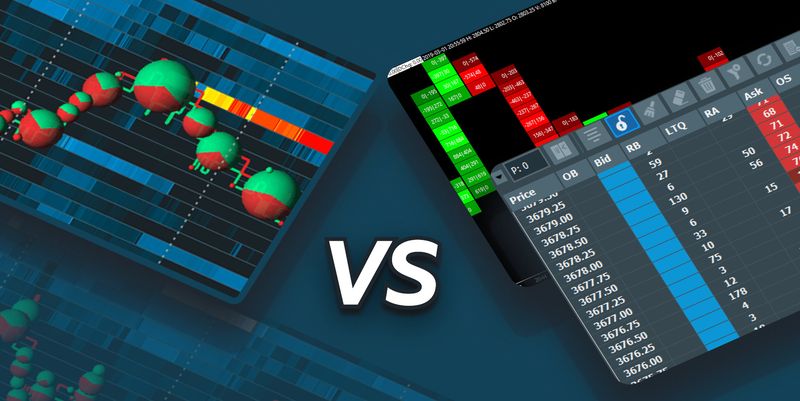
Standard Candlesticks vs The Bookmap Matrix
When Bookmap wins: You need to know exactly where the market will face resistance before it gets there, and you trade on tight timeframes. When Candlesticks win: You are performing high-level technical analysis on daily or weekly charts to identify broader macroeconomic trends.
Bookmap vs Traditional DOM (Depth of Market)
While a traditional DOM shows you the order book, it only shows the current moment. Bookmap takes the DOM data and visualizes it historically. If a massive order sat at $4000 for an hour and was suddenly pulled, a standard DOM won’t show you that history. Bookmap’s heatmap records that event permanently on your screen.
9. What real users are saying
As a professional-grade tool, Bookmap is highly regarded in proprietary trading and futures scalping communities.
Most-mentioned positives:
- The “Aha” Moment: Many users report that once they learned to read the heatmap, they could never go back to standard charts.
- Trade Confidence: Traders feel more confident holding a position when they can visually see a massive wall of liquidity supporting their trade.
- Excellent Education: Users frequently praise the Bookmap YouTube channel and community for helping them navigate the learning curve.
Recurring pain points:
- Data Feed Complexities: Frustrations often arise not from the software, but from managing subscriptions to external data providers like Rithmic or dxFeed.
- Visual Clutter: Beginners often complain that the chart is too “noisy” until they learn how to properly filter the volume bubbles.
“I spent two years struggling to scalp the ES (S&P 500 Futures) using standard indicators. Moving to Bookmap was like turning on the lights in a dark room. You stop guessing where support is and start actually seeing it. Yes, the data feeds are expensive, but avoiding one bad trade pays for the whole month.”
- Independent Futures Day Trader
10. How to get started with Bookmap
Step 1: Download the Software
Visit the Bookmap website and download the desktop application. You can start with the free Digital tier if you want to test it out.
Step 2: Connect a Data Feed
If you are trading crypto, connect your Binance or Coinbase API keys (read-only) to pull in free Level II data. If you are trading futures, you will need to configure your Rithmic, Tradovate, or dxFeed credentials.
Step 3: Configure Your Chart
Open a chart for a highly liquid asset (like BTC/USDT or ES futures). Spend time adjusting the contrast and color scheme of the heatmap so that the liquidity walls stand out clearly on your monitor.
Step 4: Filter Volume Bubbles
Go into the settings and filter out small volume bubbles. If you only want to see institutional activity, set the minimum bubble size to a value that filters out retail noise.
Step 5: Practice in Replay Mode
Do not trade live immediately. Use Bookmap’s Replay Mode to record a morning session and watch how the heatmap and volume bubbles interact at key levels.
11. Frequently asked questions
Is Bookmap free to use?
Bookmap offers a free 'Digital' tier that allows you to connect to cryptocurrency exchanges and view real-time data. For traditional markets like Stocks and Futures, you will need a paid subscription (Global or Global+) starting at $49/month.
Does Bookmap include market data?
No. For Stocks and Futures, Bookmap is purely a visualization software. You must purchase a Level II data subscription separately from a provider like dxFeed or Rithmic to feed data into Bookmap.
Can I execute trades directly from Bookmap?
Yes. Bookmap features a one-click trading panel (TCP) that allows you to place limit and market orders directly on the chart, provided you have connected a supported brokerage account.
Does Bookmap work on Mac?
Yes, Bookmap supports both Windows and macOS. However, because it is resource-intensive, ensure your Mac meets the recommended hardware specifications for optimal performance.
Why does the chart look so messy?
By default, Bookmap shows every single micro-transaction, which creates visual noise. The key is to use the filtering tools to hide small volume bubbles and adjust the heatmap contrast so only significant liquidity pools are highlighted.