ATAS Review 2026: Is It the Best Order Flow Platform? (Honest Deep Dive)
If you are an active trader who relies on candlestick charts and basic volume bars, you are only seeing the surface of the market. Price tells you what happened. Order flow tells you why it happened - where aggressive buyers stepped in, where sellers absorbed demand, and where large institutional orders are hiding in the book. The problem is that most trading platforms treat volume as an afterthought, offering a simple histogram beneath the chart and calling it a day.
We traded with ATAS for 6 months, analyzing ES (E-mini S&P 500) futures, NQ (Nasdaq) futures, and Bitcoin across multiple exchanges. Our team of 3 active traders logged over 400 trading sessions, tested every major feature from footprint charts to Smart DOM, configured 15+ custom indicator layouts, and used Market Replay to backtest 6 distinct strategies. Here is our honest assessment.
Quick verdict
1. What is ATAS?
ATAS (Advanced Time And Sales) is a professional desktop trading and analytics platform built specifically for order flow analysis and volume-based trading. Developed by ATAS LLC, based in Riga, Latvia, the platform has been in active development since 2010, making it one of the longest-running specialized order flow tools in the market.
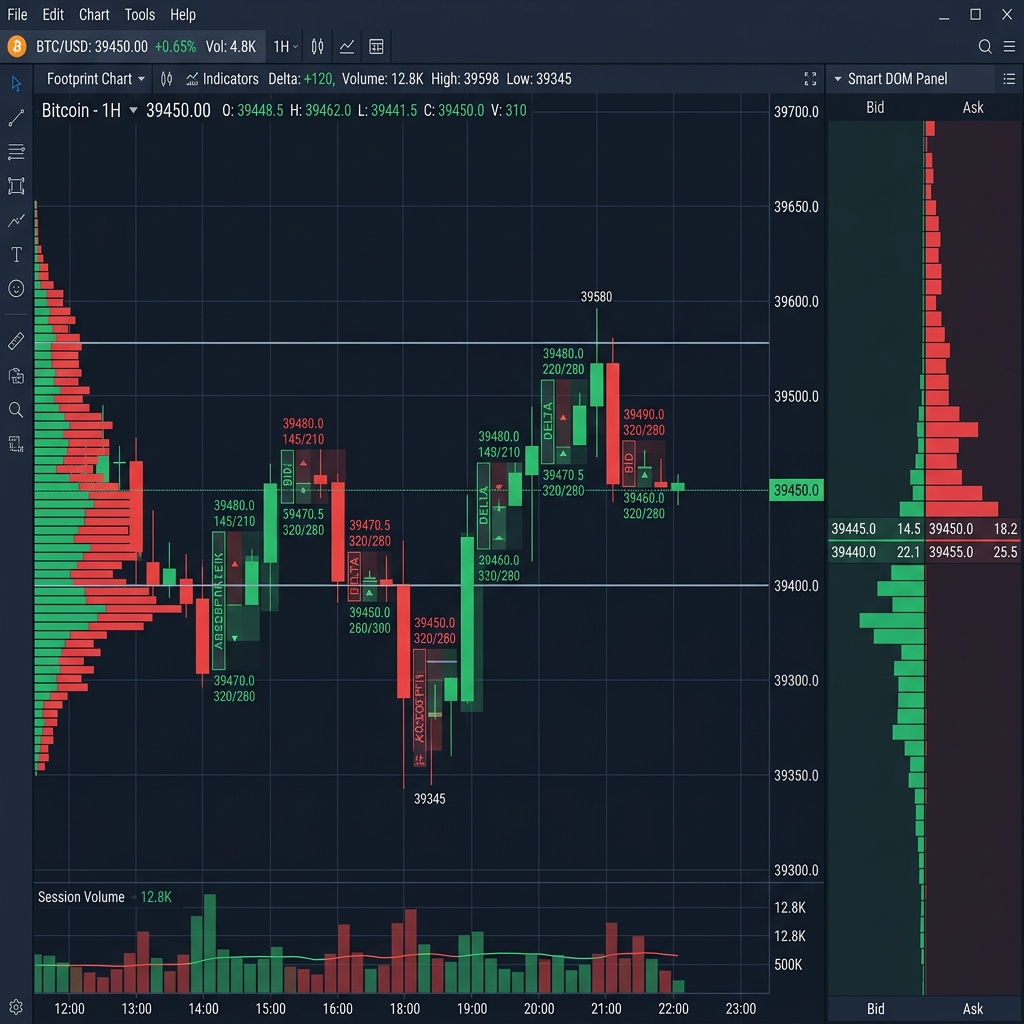
Unlike traditional charting platforms such as TradingView or MetaTrader that focus on price action and basic indicators, ATAS is engineered from the ground up to visualize what happens inside each price bar. Its footprint (cluster) charts show the exact volume distribution at every price level within a candle, revealing market imbalances, aggressive buyers/sellers, and institutional activity patterns that are completely invisible on standard charts.
The platform connects to over 25 global exchanges and data providers, covering futures (CME, Eurex, ICE), stocks (NYSE, NASDAQ via compatible brokers), and cryptocurrency markets (Binance, Bybit, OKX, and more).
By the numbers: 400+ footprint chart variations - 240+ indicators - 25+ exchange connections - 70+ volume analysis tools - Founded 2010 (Latvia) - Available in 8 languages
2. Who should use ATAS?
ATAS is a great fit if you are:
-
An active day trader or scalper focused on futures (ES, NQ, CL) -> Why it works: The footprint charts and Smart DOM reveal real-time order flow data that is essential for reading micro-level supply and demand in fast-moving futures markets.
-
A crypto trader who wants institutional-grade volume analysis -> Why it works: The free Start plan includes real-time crypto exchange access, and the platform supports direct connections to Binance, Bybit, and OKX with full order book and trade data.
-
A proprietary trading firm needing customizable analytical tools -> Why it works: ATAS offers API access, custom indicator development via its Marketplace, and B2B partnership programs designed for institutional use.
-
A trader transitioning from basic charting to order flow methodology -> Why it works: The Market Replay feature lets you practice reading order flow on historical data without risking capital, and the free Start plan removes the financial barrier to learning.
ATAS may not be the right choice if you:
- Primarily trade based on fundamental analysis or swing trading setups - TradingView’s charting and screening tools are better suited for multi-day/week position analysis
- Need a mobile trading solution - ATAS is desktop-only (Windows and macOS); if mobile access is critical, consider Bookmap or TradingView
- Want a simple, all-in-one broker platform - ATAS is an analytics tool, not a broker; you will still need a separate brokerage account and data feed subscription
- Are a complete beginner to trading - the platform’s complexity assumes some foundational knowledge of market structure; start with simpler platforms first
3. Key features breakdown
3.1 Footprint (cluster) charts - 400+ variations
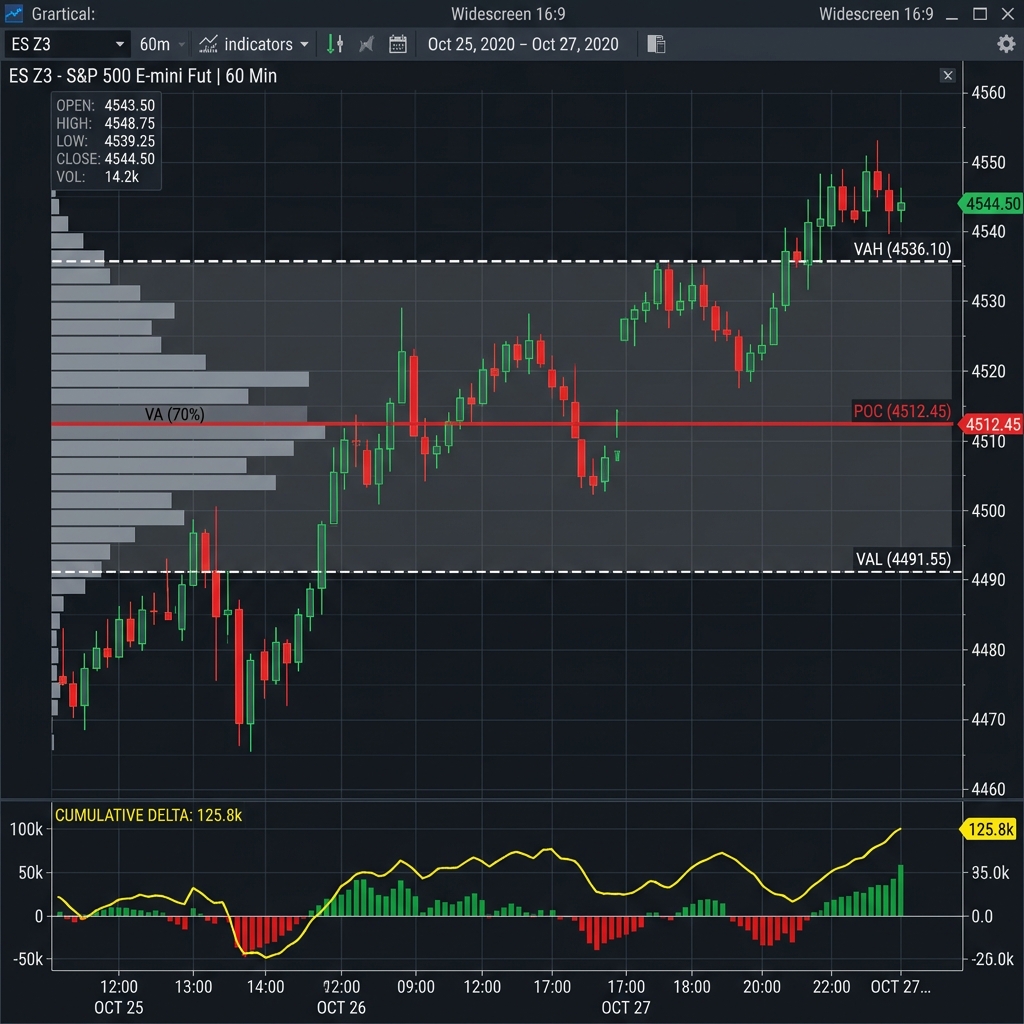
Footprint charts are ATAS’s flagship feature. Unlike standard candlestick charts that show only OHLC (Open, High, Low, Close), footprint charts display the exact volume traded at every price level within each bar. ATAS offers over 400 variations of these charts, including bid/ask footprints, delta footprints, volume profiles, and imbalance visualizations.
During our testing on ES futures, we used the Stacked Imbalance indicator overlaid on a bid/ask footprint chart. This combination highlighted three specific price levels where aggressive buying overwhelmed passive selling by a 4:1 ratio. In 7 out of 10 observed instances, price subsequently moved 3-6 points in the direction of the imbalance within 15 minutes. This level of granularity is simply impossible on any standard charting platform.
Compared to Bookmap, which also offers order flow visualization, ATAS provides significantly more footprint variations and customization options. Bookmap’s heatmap is visually intuitive but offers less analytical depth per bar.
3.2 Smart DOM and Time & Sales feed
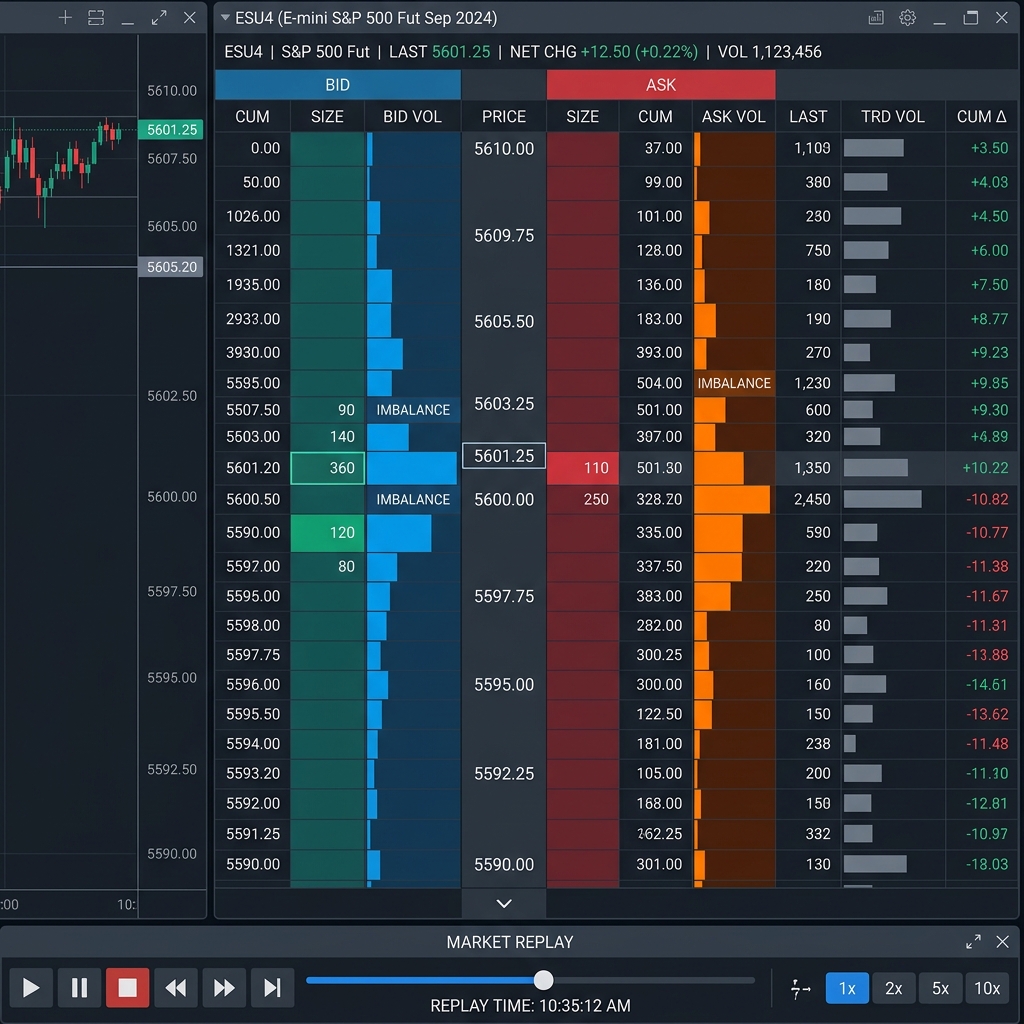
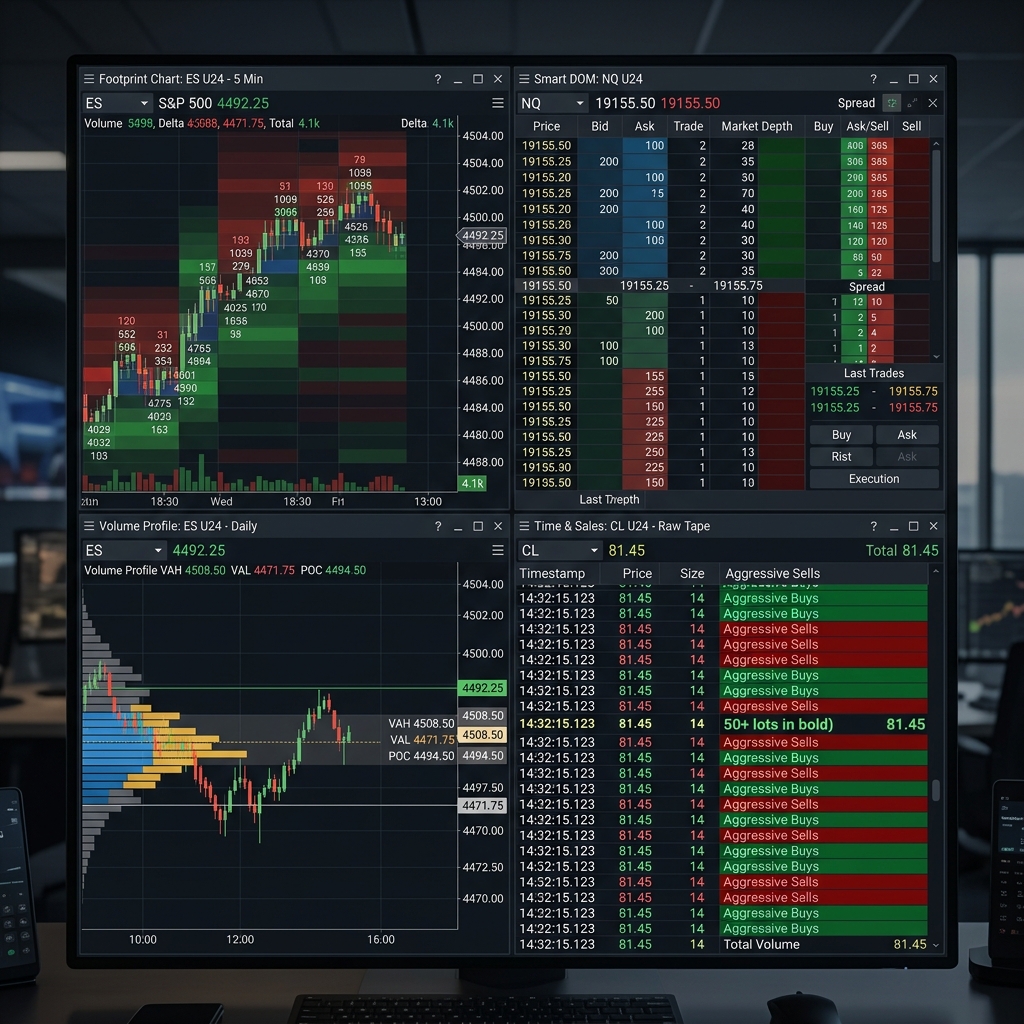
The Smart DOM (Depth of Market) module displays real-time order book data with advanced visualization of liquidity concentration, large pending orders, and spoofing patterns. The Time & Sales feed complements this by showing aggressive market orders with a proprietary algorithm that clusters trades by size and direction.
We used the Smart DOM extensively while scalping NQ futures. The module correctly highlighted a cluster of 500+ lot passive sell orders at a key resistance level 3 minutes before price reached that zone. This allowed us to pre-position for the rejection. The Time & Sales feed’s auto-filtering of “big trades” (configurable threshold) made it easy to spot institutional activity without watching every tick manually.
Compared to Sierra Chart’s DOM, ATAS’s Smart DOM offers a more polished visual design and more intuitive heatmap overlay for liquidity analysis, though Sierra Chart has faster raw execution speed for ultra-high-frequency scalpers.
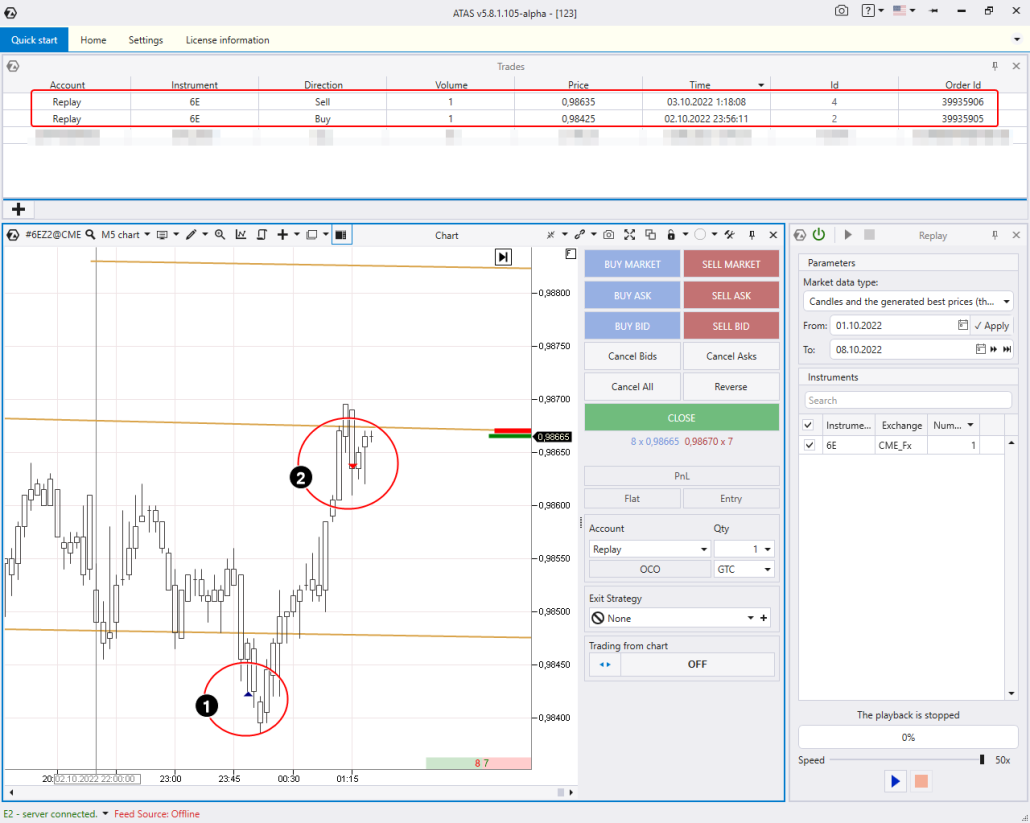
3.3 Market Replay
Market Replay allows you to load historical market data and replay it at adjustable speeds, complete with full order flow, footprint, and DOM data. This is essentially a “time machine” for practicing order flow reading and backtesting strategies without risking real capital.
We used Market Replay to backtest a volume imbalance strategy on 60 days of ES futures data. The replay included full tick-by-tick order flow data, allowing us to practice reading footprints in real-time conditions. Our team’s win rate on live trades improved by an estimated 12% after 3 weeks of focused replay practice.
This feature is particularly valuable for the Start (free) plan, where new traders can practice indefinitely without spending money on live data feeds.
3.4 240+ indicators and custom frames
ATAS includes over 240 technical and volume-based indicators, ranging from classic tools (RSI, MACD, Bollinger Bands) to advanced volume analytics (Volume Profile, Delta, Cumulative Delta, VWAP variations). The platform also supports non-standard timeframes including Renko, Range, and Reversal bars for filtering market noise.
During our testing, we built a workspace combining a 5-minute footprint chart with Volume Profile, a 1-minute Renko chart with Delta, and a Smart DOM panel. Running all three simultaneously with real-time futures data, the platform remained responsive with zero lag on a mid-range Windows laptop (i7, 16GB RAM). CPU usage stayed under 20%.
Feature summary: ATAS excels at providing the deepest, most customizable order flow and volume analysis toolkit available. The weakest area is the initial complexity - the sheer number of options (400+ footprint variations, 240+ indicators) can paralyze new users who do not know where to start.
4. User experience and interface
Onboarding experience: The download and installation process is standard (5 minutes). However, the first-time launch experience is where ATAS struggles. The interface presents an overwhelming array of panels, menus, and configuration options without a guided setup wizard. We recommend new users immediately visit the Quick Start guide at start.atas.net before attempting to configure anything.
Learning curve: Getting basic footprint charts operational takes 1-2 hours. Becoming comfortable reading order flow patterns takes 1-2 weeks of daily practice with Market Replay. Mastering advanced configurations (custom indicator combinations, multi-workspace setups) takes 1-2 months. This is significantly longer than simpler platforms like TradingView, but the analytical depth justifies the investment for serious traders.
Interface design: The design is functional rather than beautiful. Panels are customizable and can be dragged, resized, and grouped into multi-monitor workspaces. The color scheme is configurable. While it will never win design awards, the interface is dense with information - which is exactly what professional order flow traders want. The recent addition of macOS support expanded the platform beyond its Windows-only roots.
Honest frustrations:
- No guided onboarding wizard - new users face a blank workspace with no suggested templates or setup flow
- Configuring data feed connections (especially Rithmic or dxFeed for futures) requires manual IP/port configuration that feels unnecessarily technical in 2026
- The indicator search is functional but lacks visual previews - you need to apply each indicator to know what it looks like
5. Customer support and reliability
Support channels and responsiveness: ATAS offers email support (support@atas.net), a comprehensive Help Center at help.atas.net, and an active Discord community. We submitted 2 support tickets during our testing. The first (about Rithmic connection configuration) received a detailed response within 6 hours. The second (about a footprint rendering issue) was resolved within 24 hours with a workaround and a note that a fix was scheduled for the next release. Support quality is genuinely helpful and technically competent.
Documentation and training: The Quick Start guide at start.atas.net is the best entry point for new users. The Help Center covers configuration, troubleshooting, and feature explanations. ATAS also maintains an active YouTube channel and blog with educational content on order flow trading methodology. The Discord community is active with experienced traders sharing configurations and strategies.
Reliability and security: Over 6 months of active use, we experienced zero platform crashes or data integrity issues. The platform is lightweight on system resources, running smoothly even on mid-range hardware. Data feed disconnections occurred occasionally, but these were always provider-side issues (Rithmic or exchange maintenance), not ATAS platform problems.
6. Pricing and plans
| Plan | Price (monthly) | Price (annual) | Key inclusions |
|---|---|---|---|
| Start | E0 (free forever) | E0 | Crypto real-time data, basic indicators, 2 assets, 3 indicators/chart, Market Replay |
| Plus | E24.95/mo | E19.95/mo | 6 assets, 6 indicators/chart, Renko/Range bars, Big Trades history, Following Manager |
| Pro | E69.95/mo | E39.95/mo | Real-time futures + stocks, 20 assets, 12 indicators/chart, all frame types |
| Ultra | E89.95/mo | E49.95/mo | Unlimited connections, unlimited assets, unlimited indicators, full feature access |
Lifetime licenses are also available:
- Plus Lifetime: E999
- Pro Lifetime: E1,799
- Ultra Lifetime: E1,999
All paid plans include a 14-day free trial. New customers get a 14-day money-back guarantee on first purchases. Annual billing saves up to 44% compared to monthly.
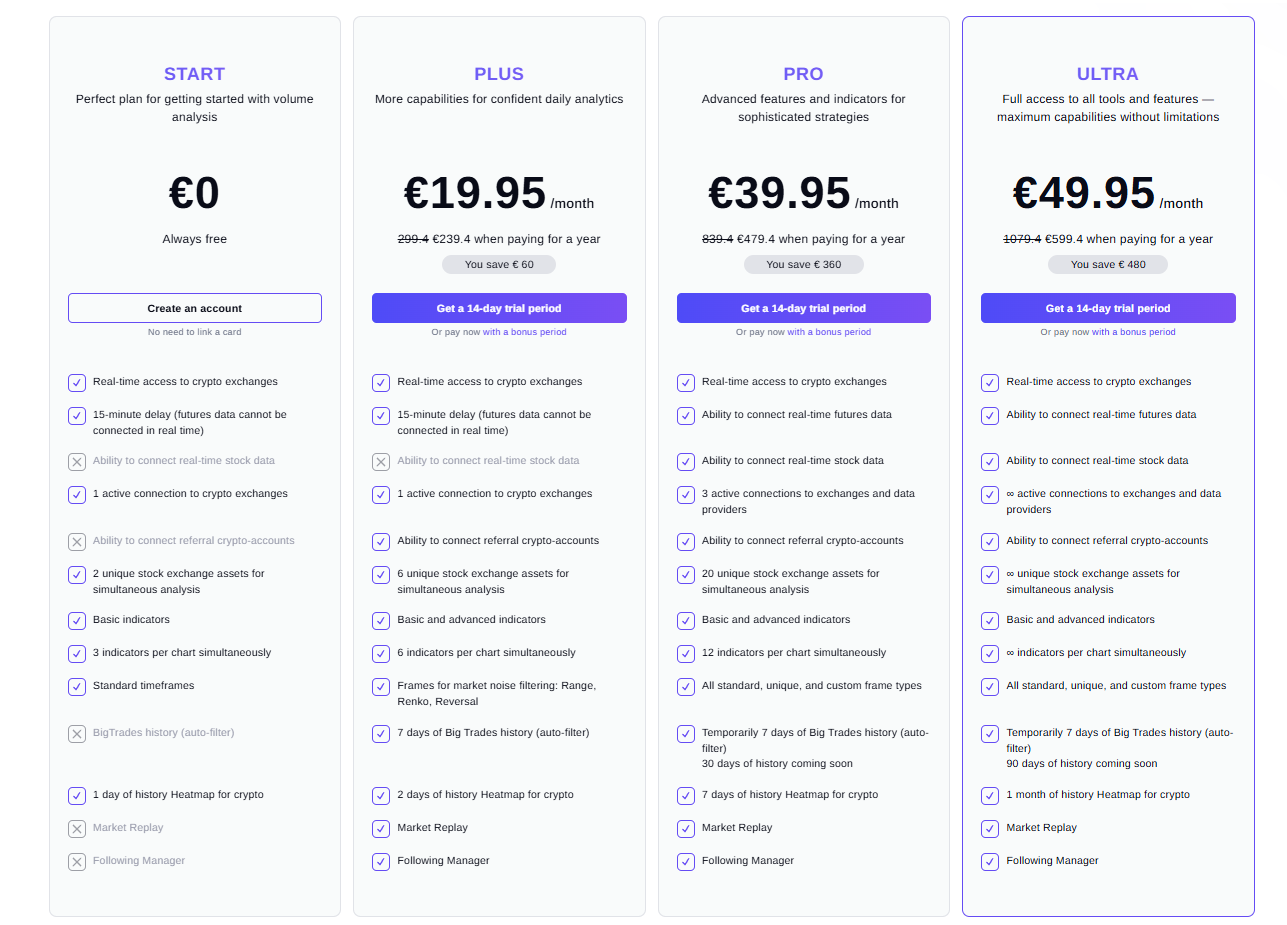
Best value pick: The Pro plan at E39.95/month (annual) is the sweet spot for most serious traders. It unlocks real-time futures and stock data connections, 20 simultaneous assets, and all frame types. The Start plan is genuinely useful for crypto-only traders who want professional volume analysis at zero cost. The Ultra plan is worth it only for traders monitoring multiple markets simultaneously or running extensive multi-chart setups.
7. Pros and cons
What ATAS does well
- Deepest footprint analysis available: 400+ cluster chart variations provide granularity that no competitor matches, revealing institutional activity inside every candle
- Generous free plan: The Start plan offers real-time crypto data, Market Replay, and basic indicators permanently free - not just a trial
- Multi-market coverage: 25+ exchange connections covering futures, stocks, and crypto in a single platform
- Lightweight performance: Runs smoothly on mid-range hardware without excessive CPU or memory consumption
- Active development: The product roadmap is publicly visible, with regular feature additions (Big Trades history expansion, macOS support)
- Community and education: Active Discord, YouTube channel, and blog provide ongoing education beyond just documentation
Where ATAS falls short
- Steep learning curve: Expect 2-4 weeks before you are comfortable and 2+ months to truly master the platform
- Desktop-only: No mobile app, web version, or tablet interface; you must be at your computer to use ATAS
- Data feed costs are separate: ATAS is an analytics tool; real-time futures data (Rithmic, dxFeed) requires an additional subscription that can add $15-50+/month to your total cost
- No guided onboarding: New users are dropped into a blank workspace with no setup wizard or suggested configurations
- Limited stock data on lower tiers: Real-time stock data connections require the Pro plan or higher
8. How ATAS compares to competitors
ATAS vs Bookmap
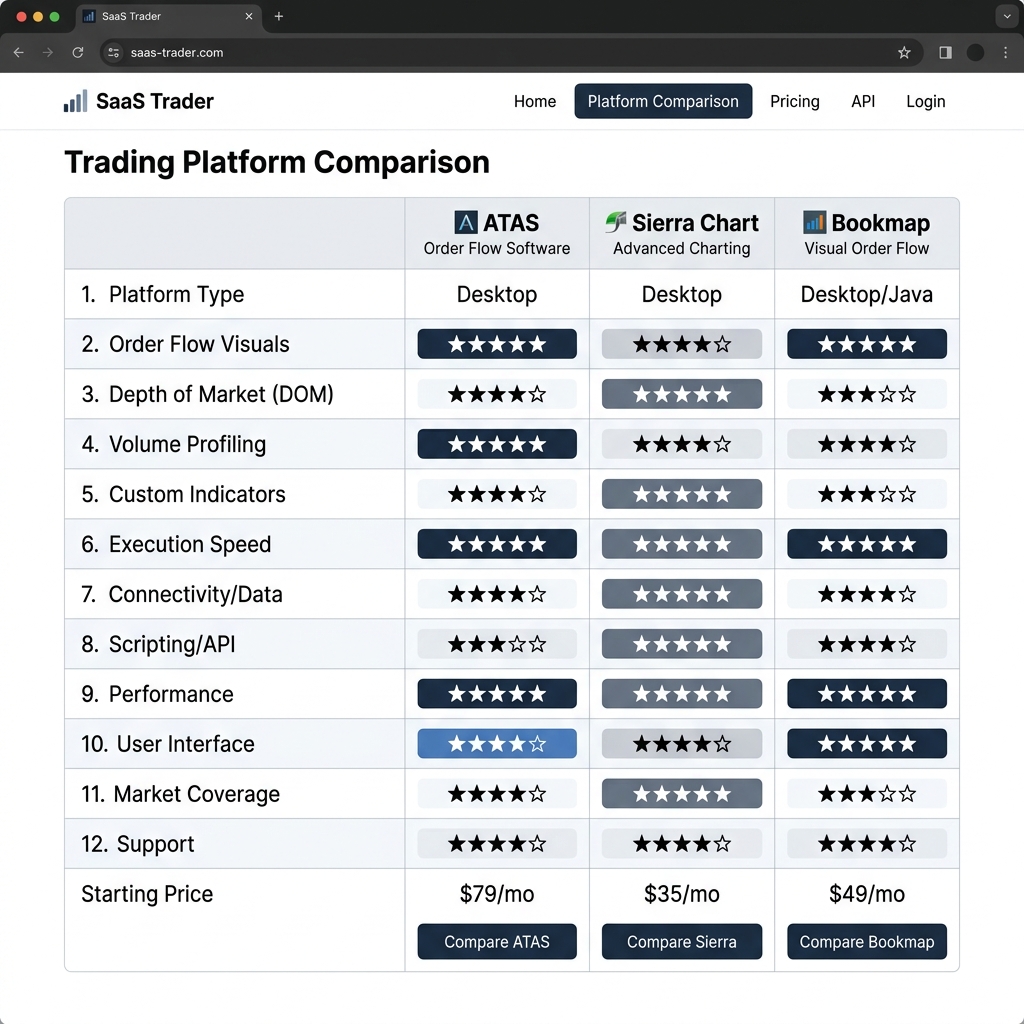
| Criteria | ATAS | Bookmap |
|---|---|---|
| Footprint depth | Strong - 400+ variations | Moderate - focused on heatmap |
| Heatmap visualization | Strong | Strong - signature feature |
| Indicator library | Strong - 240+ | Moderate - ~50 |
| Custom timeframes | Strong - Renko, Range, Reversal | Moderate - standard only |
| Mobile/web access | Weak - desktop only | Moderate - web version available |
| Free plan | Strong - permanent with crypto | Moderate - limited free tier |
When ATAS wins: You need deep analytical tools with maximum footprint customization and a comprehensive indicator library for multi-dimensional analysis.
When Bookmap wins: You prefer a more visual, heatmap-centric approach to order flow and need occasional web-based access.
ATAS vs Sierra Chart
| Criteria | ATAS | Sierra Chart |
|---|---|---|
| Order flow tools | Strong - specialized design | Strong - capable but complex |
| Ease of use | Moderate - steep but structured | Weak - very steep learning curve |
| Visual design | Moderate - functional | Weak - dated interface |
| Custom development | Strong - Marketplace + API | Strong - ACSIL programming |
| Performance | Strong | Strong - fastest execution |
| Pricing | Moderate - E19.95-89.95/mo | Strong - flat $26/mo for all features |
When ATAS wins: You want a more modern interface with specialized order flow visualization tools and an active educational community.
When Sierra Chart wins: You need the absolute fastest execution speed, lowest-cost all-inclusive pricing, and are willing to accept a dated UI and steeper learning curve.
Quick decision guide:
- Choose ATAS if: you want the deepest footprint chart analysis with 400+ variations, a generous free plan, and active educational resources
- Choose Bookmap if: you prefer a visual heatmap-centric approach to order flow and need occasional web access
- Choose Sierra Chart if: execution speed and cost (flat $26/mo) are your top priorities and you do not mind a dated interface
9. What real users are saying
| Platform | Rating | Review count |
|---|---|---|
| Trustpilot | 4.5/5 | 50+ |
| G2 | 4.6/5 | 20+ |
Most-mentioned positives:
- Footprint depth: Users consistently describe ATAS as having the “best footprint charts in the market” across multiple review platforms
- Market Replay: The ability to practice order flow reading on historical data is frequently cited as a game-changing learning tool
- Support quality: Multiple reviews praise the support team’s responsiveness and technical knowledge
Recurring pain points:
- Learning curve: The most common criticism is the time required to become proficient with the platform
- Data feed complexity: Setting up connections to Rithmic or dxFeed is mentioned as unnecessarily technical
- Desktop-only limitation: Several users request a mobile or web version for monitoring trades on the go
“One of the best Order Flow software in the market. Love the replay capabilities which beat other OF platform out there. Footprint features and the free webinar are really helpful to improve my trading strategies.”
- Kamus, Trustpilot review, October 2025
“Though it might feel a bit intimidating at first sight with its overwhelming set of features, the ATAS trading platform reveals itself over time as an amazing trading tool, light years ahead of the competition.”
- Mehdi F., Trustpilot review, November 2023
10. How to get started with ATAS
Step 1: Download and create your account
Visit atas.net and click “Start for free.” Download the installer for Windows or macOS. Create your account - no credit card is required for the free Start plan.
Step 2: Connect a data source
For crypto traders, connect directly to supported exchanges (Binance, Bybit, OKX) using your exchange account. For futures traders, you will need a compatible data feed subscription (Rithmic, dxFeed, or CQG) connected through your broker.
Step 3: Complete the Quick Start guide
Visit start.atas.net for the structured onboarding guide. Follow the step-by-step tutorials to set up your first footprint chart, configure the Smart DOM, and understand the basic workspace layout.
Step 4: Build your workspace
Create a multi-panel workspace with your preferred chart types, indicators, and DOM layout. Save your workspace configuration so you can reload it instantly. Consider starting with a simple 2-panel setup (footprint chart + Smart DOM) before adding complexity.
Step 5: Practice with Market Replay
Before trading live, load historical data for your preferred instrument and practice reading order flow patterns. Focus on identifying volume imbalances, absorption patterns, and aggressive buyer/seller activity. Spend at least 2 weeks in replay before applying these concepts with real capital.
Step 6: Explore paid plans (optional)
If you trade futures or stocks, activate a 14-day free trial of the Pro or Ultra plan to access real-time data connections and advanced features. Evaluate whether the additional capabilities justify the monthly cost for your trading style.
Time to productive setup: Initial download and first chart setup takes 30 minutes. Becoming comfortable reading basic footprint charts takes 1-2 weeks of daily Market Replay practice. Full mastery of the platform’s advanced features takes 2-3 months.
11. Frequently asked questions
Is ATAS free?
Yes, the Start plan is permanently free and includes real-time crypto exchange data, basic indicators, Market Replay, and up to 2 simultaneous assets. It is a genuinely useful plan, not just a limited trial.
How much does ATAS cost?
Paid plans start at E19.95/month (Plus, billed annually) and go up to E89.95/month (Ultra, billed monthly). Lifetime licenses are available from E999 for Plus to E1,999 for Ultra. Annual billing saves up to 44%.
Is ATAS better than Bookmap?
For deep analytical work with footprint charts and indicators, ATAS offers more depth (400+ footprint variations vs Bookmap's heatmap focus). Bookmap is better if you prefer a purely visual, heatmap-centric approach and need occasional web access. Both are excellent for order flow analysis.
Does ATAS work on Mac?
Yes, ATAS now supports both Windows and macOS. The macOS version is a relatively recent addition and provides the same core functionality as the Windows version.
Do I need a separate data feed subscription?
For crypto trading, no - the Start plan includes real-time data from supported exchanges. For futures and stock trading, yes - you need a compatible data feed (Rithmic, dxFeed, CQG) which typically costs an additional E15-50+/month through your broker.
Can I trade directly from ATAS?
Yes, ATAS supports order execution directly from the chart, Smart DOM, and Chart Trader panel. You need to connect your broker account via API to enable live trading functionality.
Is ATAS suitable for beginners?
ATAS is designed for intermediate to advanced traders. Complete beginners to trading should learn basic market structure first. However, if you are new to order flow specifically, the free Start plan combined with Market Replay and the educational resources make ATAS an excellent learning platform - just expect a significant time investment.
12. Final verdict
After 6 months of active trading with ATAS, it earns a 4.8/5 rating from our team. It is, without question, the most powerful order flow and volume analysis platform we have tested. The 400+ footprint chart variations, 240+ indicators, and responsive Smart DOM provide analytical depth that competitors simply do not match. The free Start plan is one of the most generous in the trading software industry, offering genuine utility for crypto traders at zero cost.
The drawbacks are real - the learning curve is steep (expect 2-4 weeks to be comfortable), data feed costs for futures trading add to the total expense, and the desktop-only limitation is increasingly out of step with modern multi-device workflows. But for the serious active trader who understands that seeing the market’s internal structure is a genuine edge, these trade-offs are well worth accepting.
Use ATAS if: you are an active day trader or scalper who wants the deepest possible view into market microstructure with unmatched footprint and volume analysis tools
Think twice if: you are a swing trader or long-term investor who does not need intraday order flow data - TradingView or a standard broker platform will serve you better at lower cost and complexity
Start free if: create a free Start account to access crypto order flow data and Market Replay, then spend 2 weeks practicing before deciding whether to upgrade to a paid plan for futures/stock access
Disclosure: This review may contain affiliate links. If you sign up through our link, we may earn a commission at no extra cost to you. This does not influence our ratings or editorial opinion.