
Airbtics Review 2026: An Honest Look at the Airbnb Analytics Platform
Short-term rental investing has shifted from informal side income into a structured real estate asset class. But evaluating a vacation rental acquisition on intuition or city-wide average daily rates still produces expensive miscalculations. Seasonality, hyper-local price gradients, regulatory restrictions, and accurate ADR figures decide whether a property cash-flows or bleeds.
The precision matters. On a residential purchase intended for short-term rental, a ten percent variance in projected occupancy or ADR can turn a cash-flowing asset into a monthly deficit. Traditional real estate research tools aggregate across broad postal codes or whole metros, obscuring the pricing trends that exist between neighboring blocks.
Airbtics is a short-term rental analytics platform built for exactly that problem. It reports tracking 20M+ rental listings across 54K+ global markets, and competes directly with AirDNA and Mashvisor on market intelligence, custom map boundaries, and revenue estimation.
One scope note up front, because it changes who this tool is for: Airbtics’ standard property-level data covers Airbnb only. Its own documentation states that “for our standard property-level performance data, we currently cover Airbnb only. Scraping for VRBO, Booking.com, Expedia, Agoda, and other OTAs is available on request as part of selected enterprise solutions.” If your portfolio leans on Vrbo or Booking.com, that is a material limitation.
This review is based on Airbtics’ public product, live pricing configuration, and published accuracy documentation, checked in August 2026. Where we cite performance figures, they are attributed to Airbtics - we have not independently audited their dataset against host payouts, and we say so plainly rather than implying otherwise.
Quick verdict
Rating: 4.7 / 5
Strong global Airbnb coverage and the best-value flat-rate access in the category. Held back by Airbnb-only scope and export limits on the entry plan.
Investors and arbitrage operators comparing many markets at once - especially outside the US, where per-market pricing from competitors gets expensive fast.
Pricing: From $16/mo
Analytics Expert is $195/year (~$16/mo) or $65/month in the US. Airbtics varies pricing by country - check the rate shown in your region.
1. Overview and What Is Airbtics?
Airbtics is a cloud analytics platform for real estate investors, property managers, rental arbitrage operators, and market analysts working in short-term rentals. It collects and normalizes Airbnb listing activity worldwide and turns it into market-level financial intelligence.
Short-term rental investing differs fundamentally from long-term leasing. A long-term rental yields steady contracted rent; a vacation rental is a small hospitality business whose revenue swings daily on seasonal demand, local event calendars, day-of-week pricing, and review scores. Without historical data, forecasting annual revenue is close to impossible.
According to Airbtics’ own disclosures, the platform has been “tracking all Airbnb listings worldwide on a fixed interval since 2020 (partially since 2015),” capturing listing calendars weekly and presenting three years of history at daily granularity. Machine-learning classifiers separate real bookings from owner-blocked nights.
What you get from that pipeline:
- Revenue and ADR estimates: projected annual revenue, median nightly rates, and seasonal rate movement across three years of history.
- Occupancy distributions: month-by-month occupancy trends covering peak, shoulder, and off-peak periods.
- Custom markets and submarkets: draw your own boundaries on the map to isolate specific streets or sub-neighborhoods - unlimited on all paid tiers.
- Revenue calculator: estimate performance for any address worldwide, free and without a signup.
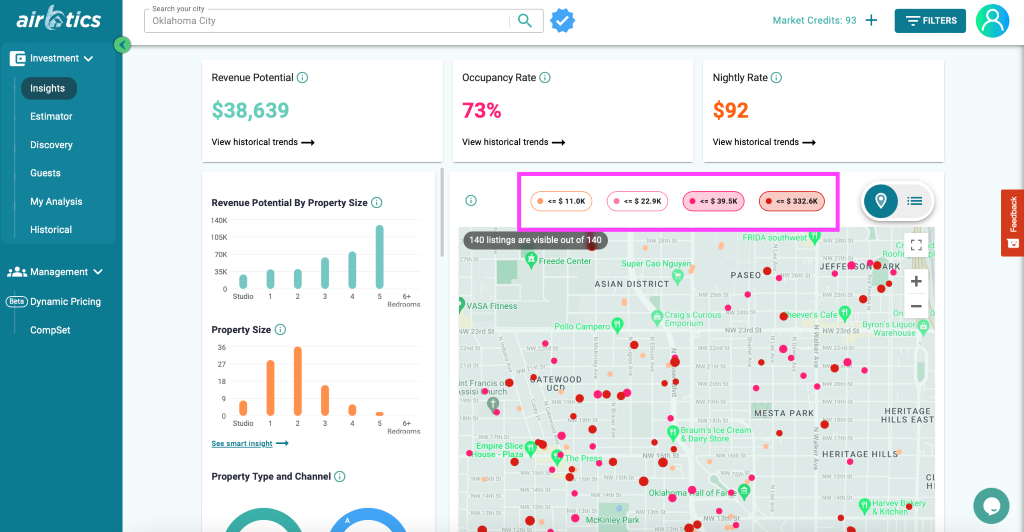
Airbtics Analytics Dashboard: market metrics and historical trends across Airbtics’ reported 20M+ listing dataset
Reported coverage: Airbtics publishes headline stats of 20M+ rental listings, 54K+ global markets, 97% data accuracy, and 9,000+ active monthly users. Note that Airbtics’ own pages are not fully consistent on scale - its calculator page also says “over 10 million rental properties” tracked weekly, and its about page cites “over 5 Million+ rental data.” We report the headline figure and the discrepancy rather than picking the flattering one.
2. How We Evaluated Airbtics
We did not run a private revenue audit against host bank statements, and we are not going to pretend we did. What we can verify, we verified directly:
- Product scope and limits: read against Airbtics’ live pricing page, feature tooltips, and FAQ - including the plan caps that aren’t obvious from the marketing copy.
- Pricing accuracy: inspected the pricing configuration served to visitors, confirming both the current rates and the fact that they vary by country and are under active A/B testing.
- Data scope: confirmed via Airbtics’ own FAQ which platforms the standard dataset covers, and which are enterprise-only.
- Accuracy claims: collected Airbtics’ published accuracy figures and third-party usage signals, and reported them as vendor claims with attribution.
That last distinction matters. Airbtics states over 96% accuracy on its pricing FAQ, 97% data accuracy in its homepage stat block, and a 97% correlation with Airbnb’s officially reported figures on its API page. Those are the company’s numbers, not an independent audit - and the small spread between them is worth knowing about. The strongest external signals are that Airbtics says its data is “used by investment banks and financial institutions trading Airbnb stocks,” that it partnered with over 100 Airbnb business owners on data quality, and that Awning’s Airbnb Estimator is powered by Airbtics - a third party staking its own product on the dataset.
3. Who Should Use Airbtics?
Airbtics is a strong fit for:
- Short-term rental investors: run financial due diligence on prospective purchases to check projected revenue, mortgage coverage, and payback timelines before making offers. Similar to how e-commerce analysts use tools like DataDive for product research, real estate investors rely on Airbtics for property acquisition research.
- Rental arbitrage operators: evaluate subleasing profitability in specific buildings or neighborhoods to confirm rental income clears the lease liability.
- Airbnb hosts and property managers: benchmark existing properties against local compsets to find pricing gaps, minimum-stay optimizations, and amenity upgrades.
- Multi-market and international researchers: this is where Airbtics is hardest to beat - one subscription covers every market worldwide, with no per-city unlock fees.
Airbtics may not be the right choice if:
- You need Vrbo or Booking.com data. The standard dataset is Airbnb-only. Multi-OTA scraping exists only as a bespoke enterprise arrangement.
- You need raw listing-level exports. Subscriptions cap you at market-level CSV on Scale; individual listing data is a separate paid add-on.
- You only need dynamic pricing automation. Airbtics is a research and valuation tool. For daily rate adjustments synced to your PMS, pricing engines like PriceLabs or Wheelhouse are the complementary tools. Operators scaling automated workflows can also examine platforms like AutoDS for broader automation concepts.
4. Custom Markets and Map Boundaries
Most real estate data platforms rely on rigid zip codes or official city boundaries. In tourist destinations, short-term rental performance varies drastically over short distances - a beachfront unit versus one three blocks inland.
City-wide medians can be badly misleading. If a beachfront condo generates ninety thousand dollars annually while an identical unit a mile inland generates forty thousand, a blended city median of sixty-five thousand is an inaccurate baseline for both.
Airbtics addresses this with custom markets and submarkets: draw your own boundary around specific streets, a lakefront shoreline, or a ski resort district, and the platform recalculates median revenue, ADR, occupancy, and active listing counts for listings inside that shape only. Airbtics documents this as the ability to “draw custom markets on the map to access detailed short-term rental insights for any location worldwide,” and it is unlimited on every paid plan - including the entry tier, which is not true of most competitors.
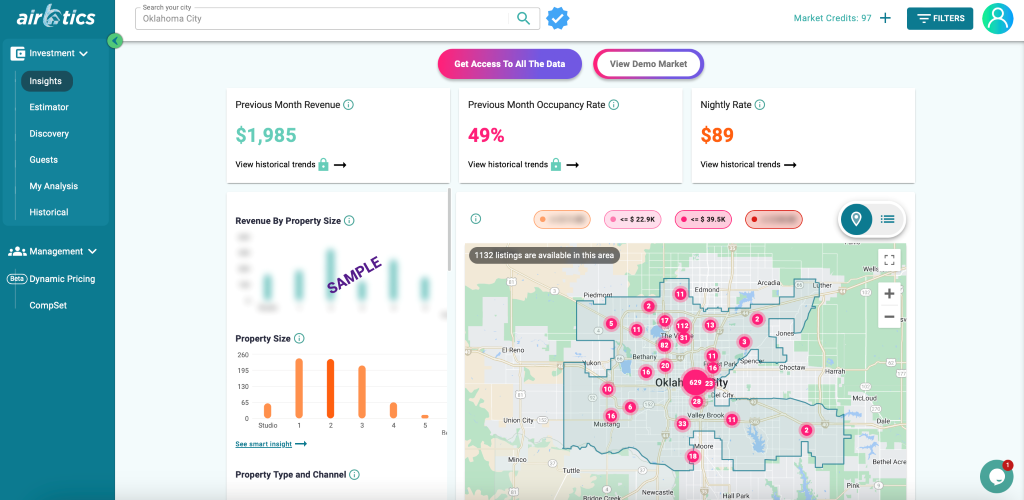
Custom market boundaries: isolate hyper-local micro-markets without city boundary restrictions
In dense urban centers or coastal strips, this lets you exclude non-comparable stock - budget shared rooms, commercial aparthotels - so revenue estimates reflect genuinely comparable assets. Saved markets can be tracked over time, with a cap of 20 on Expert and 100 on Scale.
5. The Airbnb Revenue Calculator
The calculator is Airbtics’ most accessible entry point, and worth calling out clearly: it is free and requires no signup. Airbtics states, “the Airbtics Airbnb calculator is free to use and does not require a signup. Simply enter an address anywhere in the world to estimate potential Airbnb revenue.” You can sanity-check the platform against a property you already know before paying anything.
- Address search: enter any residential address globally.
- Revenue estimates: view projected annual revenue across performance percentiles, with comparable listings.
- Expense inputs: add purchase price, down payment, mortgage rate, taxes, insurance, HOA dues, cleaning fees, and utilities.
- Financial outputs: net cash flow, cash-on-cash return, and cap rate, exportable as a branded PDF on paid plans.
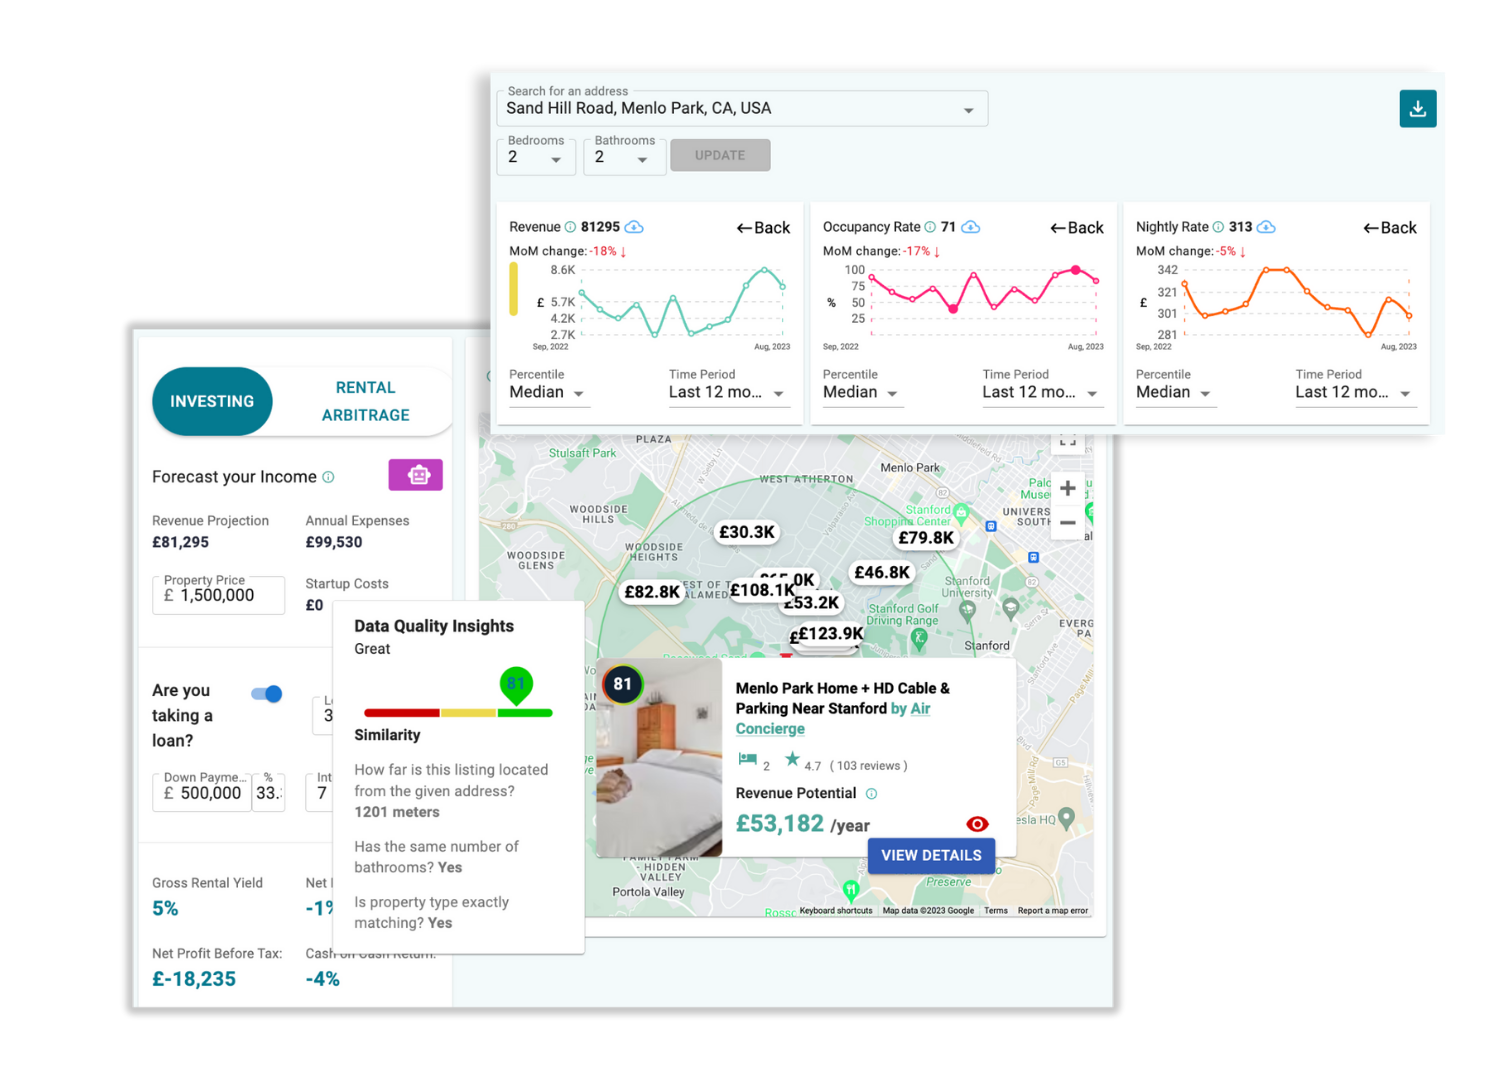
The Airbnb revenue calculator: model purchase price, operating expenses, and net cash flow
To show the kind of modeling the calculator supports, here is a worked comparison of a purchase versus an arbitrage approach. These are illustrative figures we constructed to demonstrate the calculation method - they are not Airbtics output and not a market forecast.
| Financial Metric | Property Purchase Model | Rental Arbitrage Model |
|---|---|---|
| Target Property Type | 3-Bedroom Single Family Home | 2-Bedroom Urban Apartment |
| Purchase Price / Lease | $450,000 Purchase Price | $2,400 / month Lease Rent |
| Down Payment / Deposit | $90,000 (20% Down Payment) | $7,200 (First, Last, Deposit) |
| Setup Costs | $25,000 (Closing + Furnishing) | $7,200 (Furnishing + Setup) |
| Total Cash Invested | $115,000 | $14,400 |
| Projected Gross Revenue | $68,500 / year | $48,200 / year |
| Mortgage / Rent Expense | $26,400 / year ($2,200/mo P&I) | $28,800 / year ($2,400/mo) |
| Property Tax & Insurance | $6,800 / year | $1,200 / year (Renter Insurance) |
| Utilities & Management | $7,200 / year | $4,800 / year |
| Estimated Net Cash Flow | +$28,100 / year | +$13,400 / year |
| Cash-on-Cash Return (CoC) | 24.4% CoC Return | 93.1% CoC Return |
Cash-on-cash is net cash flow divided by total cash invested - $28,100 / $115,000 and $13,400 / $14,400 respectively. The purchase model builds equity alongside a roughly twenty-four percent cash return; the arbitrage model delivers far higher cash velocity on minimal capital, but with no equity and full exposure to the lease. Airbtics lets you run both pro-formas side by side before committing.
6. Compset and Host Intelligence
Airbtics gives visibility into top-performing properties in your target submarket, though what you see depends on your plan:
- Basic Listing Insight (Expert): metrics for all active short-term rentals at yearly granularity.
- Advanced Listing Insight (Scale): the same, plus a 12-month breakdown of historical occupancy, daily rate, and revenue for individual listings.
- Amenity impact analysis: filter by amenities - pools, hot tubs, pet friendliness, dedicated workspaces - to see which command higher rates.
- Host insights: identify leading professional management companies and multi-listing hosts. Capped at 1 market/month on Expert, 20 on Scale.
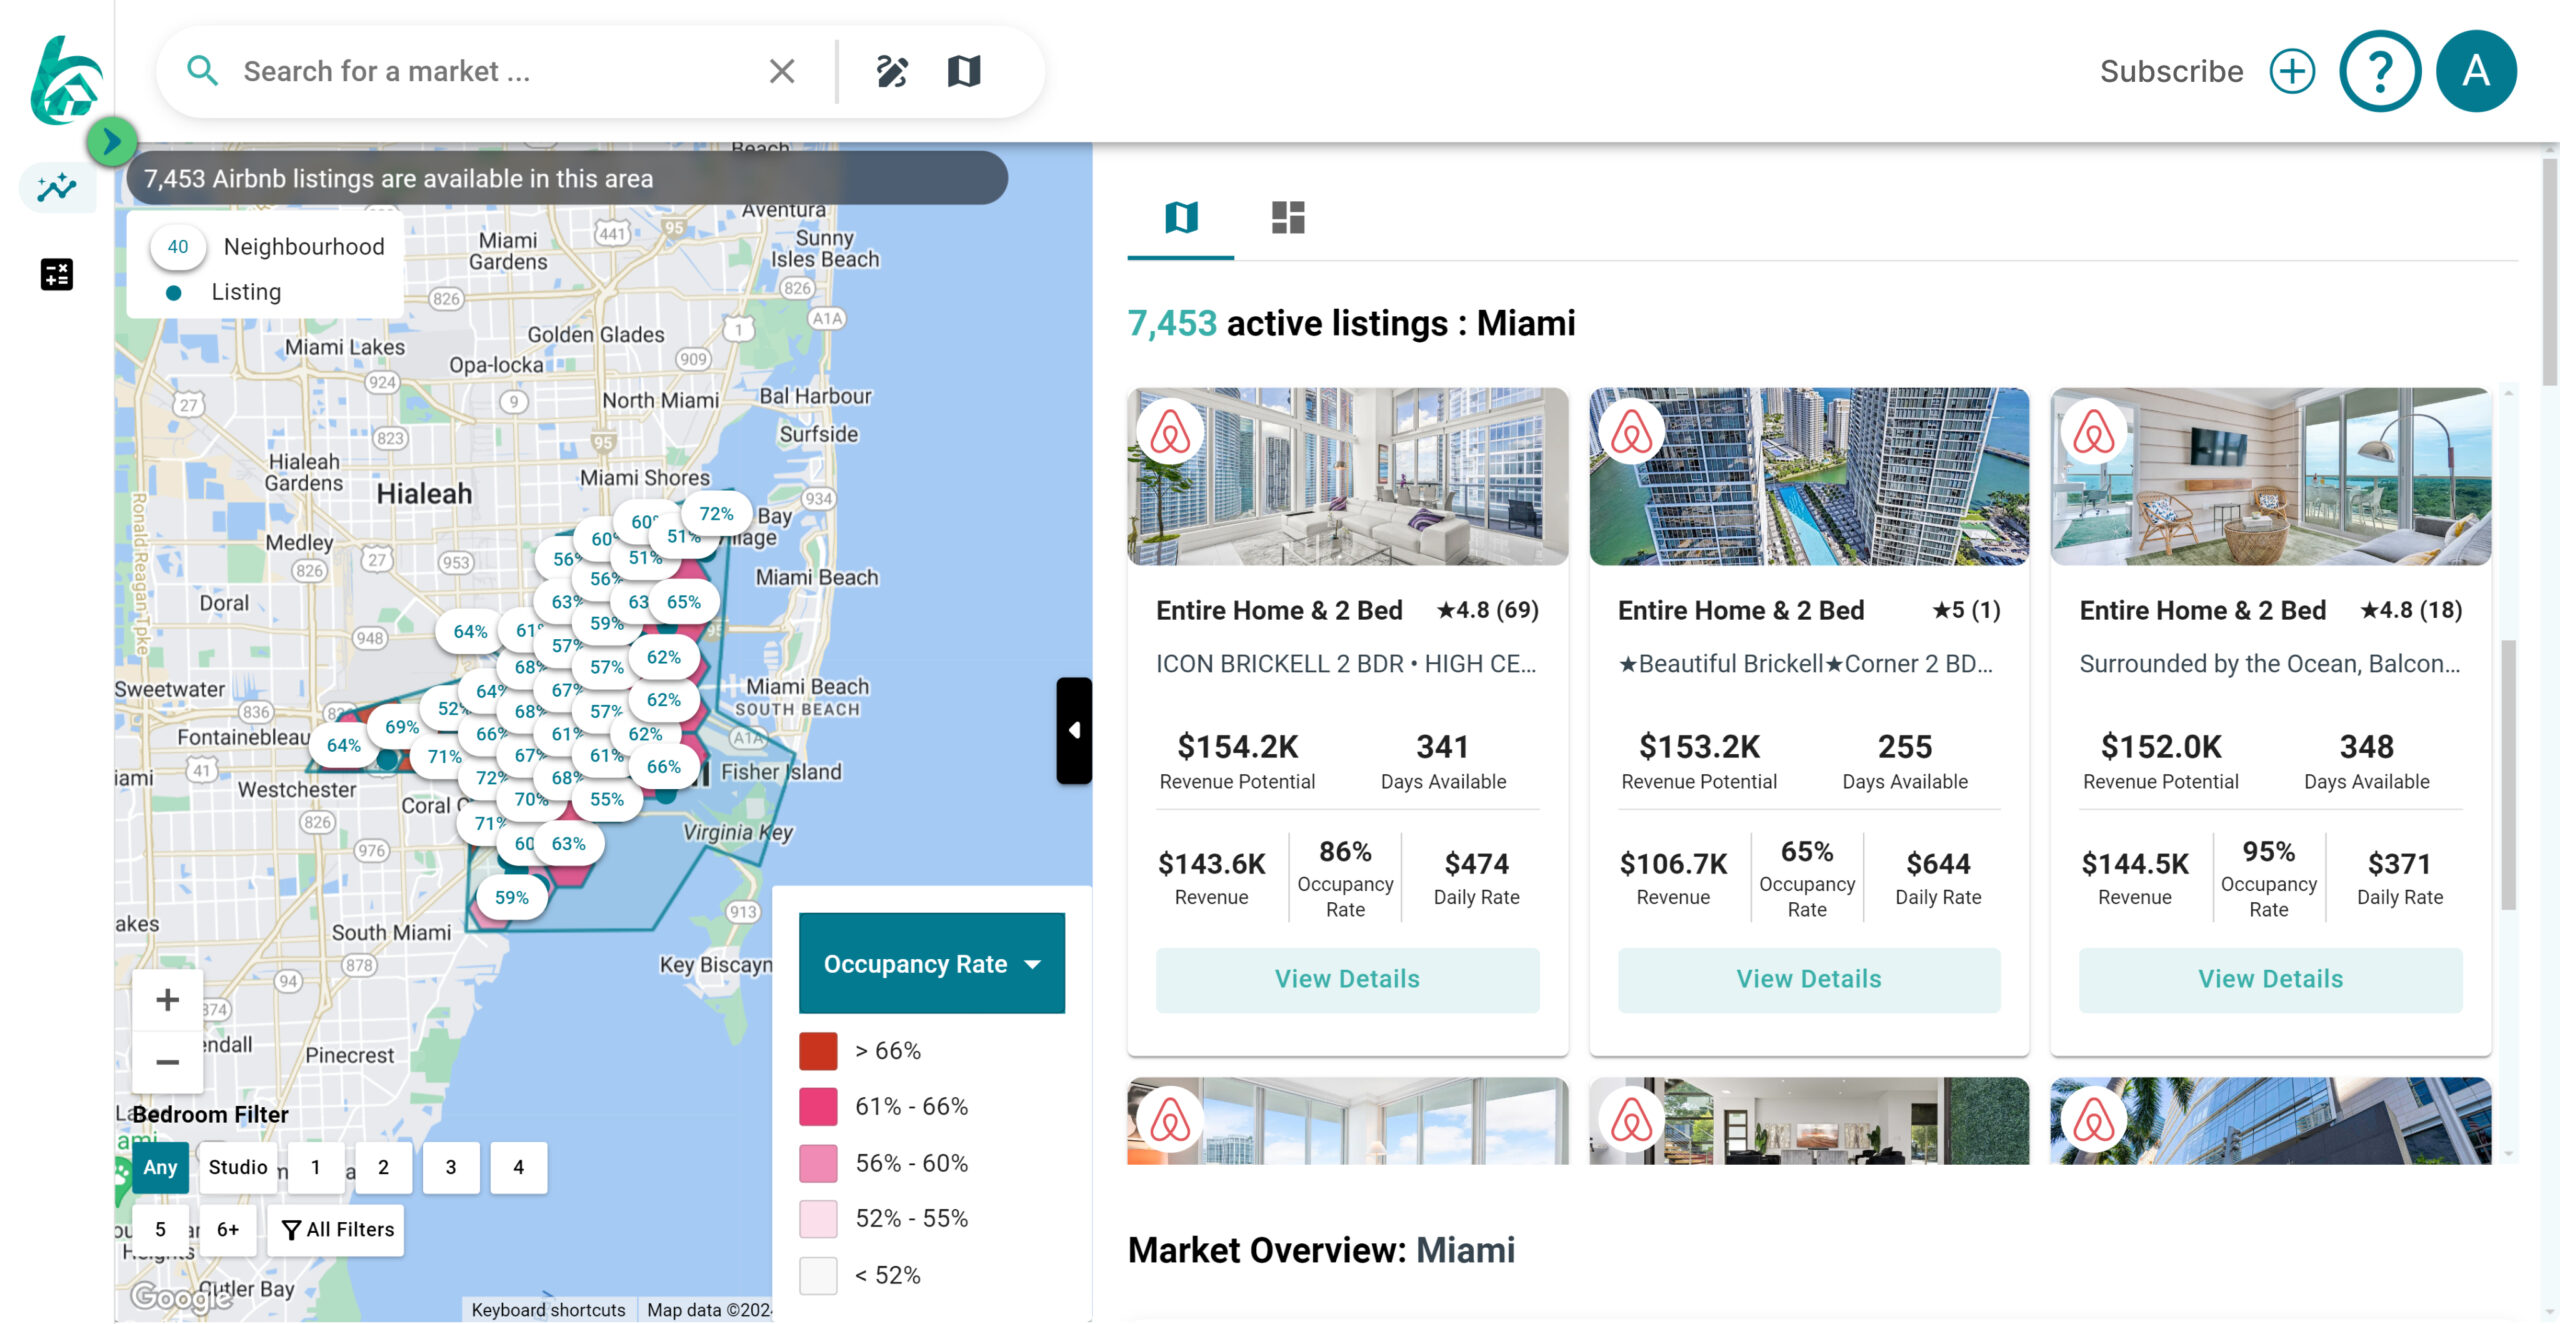
Compset intelligence: benchmark top listings, review scores, and amenity pricing impact
Compset data supports concrete renovation decisions. If adding a hot tub in a mountain market lifts ADR by forty-five dollars per night at a sixty-five percent annual occupancy rate, the roughly ten thousand six hundred dollars in additional annual revenue easily justifies a four thousand dollar installation.
Host intelligence also shows professional management penetration in a market. Markets dominated by professional operators tend to show tighter pricing competition and optimized calendars; markets full of part-time individual hosts leave more room to win share through better hospitality and dynamic pricing.
7. Data Accuracy: What Airbtics Claims, and What Can Be Verified
Accuracy is the whole product in this category, so it deserves care rather than a made-up percentage.
What Airbtics publishes:
- “Over 96% accuracy” estimating Airbnb’s actual bookings and revenue (pricing FAQ).
- “97% data accuracy” (homepage stat block).
- “Revenue predictions achieve a 97% correlation with Airbnb official reported figures” (API page).
- Tracking on a fixed weekly interval since 2020, partially since 2015, with input from over 100 partnered Airbnb business owners.
What supports those claims externally: Airbtics states its data is used by investment banks and financial institutions trading Airbnb stock, and Awning’s public Airbnb Estimator runs on Airbtics data. A third party building a consumer-facing product on the dataset is a meaningful signal - more meaningful than any self-reported percentage.
What to keep in mind: these figures are vendor-reported and vary slightly between Airbtics’ own pages, and accuracy in this category is always weakest where listing density is thin. Properties with low annual availability - a primary residence rented two weeks a year - distort market medians if included, and any estimate in a market with a handful of active listings should be treated as directional. The practical mitigation is free: run the calculator against a property whose real numbers you already know before you subscribe.
8. Pricing and Subscription Plans
Airbtics prices in tiers with a steep annual discount - the site advertises up to 77% off for annual billing.
| Subscription Tier | Monthly Billing | Annual Billing | Core Feature Set |
|---|---|---|---|
| Analytics Expert | $65 / month | $195 / year (~$16/mo) | Unlimited market views, unlimited calculator, unlimited custom markets and submarkets, 3 years historical data, basic listing insight, 20 saved markets, 5 Market Explorer searches/mo, calculator PDF export. |
| Market Intelligence Scale | $295 / month | $750 / year (~$63/mo) | Everything in Expert, plus advanced listing insight (12-month granularity), 1,000 CSV rows/month, 20 Market Explorer searches/mo, 100 saved markets, multiple saved market lists, 100 PDF exports/mo. |
| Enterprise | Custom | Custom | Bespoke short-term rental data via CSV, dashboard, or API. Multi-OTA scraping available on request. |
Three pricing caveats worth knowing before you click through:
- Prices vary by country. Airbtics serves different rates by region and is actively A/B testing them. The figures above are US rates checked on 10 August 2026; visitors elsewhere may see meaningfully lower numbers - around $39/month or $119/year in some regions. Always confirm the price displayed in your own region.
- There is no free trial on paid plans. The free Airbnb calculator is the trial - use it. Enterprise has a separate “request free trial” path.
- Listing-level data is not in any subscription. It is a paid add-on. Airbtics quotes it inconsistently on the same page, as “$150–$600 based on granularity and volume” in one tooltip and “$150–$2,000 per market” in another. Get a quote before you budget around it.
You can cancel any time via the app or by email and keep access to the end of the billing period. And critically for multi-market research, Airbtics confirms: “No, with your subscription, you gain access to all markets worldwide.”
9. Airbtics vs AirDNA vs Mashvisor
The right platform depends on coverage needs, map flexibility, and how many markets you research. Developers and analytics engineers evaluating SaaS metrics platforms like Syntx AI understand that dataset breadth and API structure determine long-term ROI.
| Feature / Capability | Airbtics | AirDNA | Mashvisor |
|---|---|---|---|
| Reported coverage | 20M+ listings, 54K+ markets | 10M+ listings, 120K+ markets, plus 1M+ partner properties | Primarily United States |
| Platforms covered | Airbnb only (standard data) | Airbnb + Vrbo | Airbnb + long-term rental data |
| Custom map boundaries | Unlimited freehand custom markets on all paid plans | Preset submarket boundaries | Zip code / city boundaries |
| Free tier | Free calculator, no signup (no free plan) | Free tier with limited searches | No free tier |
| Entry pricing | $195/yr (~$16/mo) US, all markets included | From ~$12–15/mo per market; global access ~$599/mo | Lite ~$17.99/mo (billed quarterly), Standard ~$49.99/mo |
| Booked vs blocked | ML classifiers, weekly refresh | Proprietary algorithm + partner data | Basic calendar filtering |
Read this honestly rather than as a clean sweep. Airbtics wins decisively on flat-rate global access: competitors charging per market get expensive fast if you research across states or countries, while Airbtics includes everything. It also wins on custom boundaries at the entry tier.
But AirDNA covers more markets (120K vs 54K), adds Vrbo alongside Airbnb, supplements scraping with direct partner property data, and offers a genuine free tier - all real advantages Airbtics does not match. Mashvisor remains the more natural fit for US investors who also want long-term rental comparisons.
The short version: choose Airbtics if you research many markets, work internationally, or want granular custom boundaries without per-city fees. Choose AirDNA if you need Vrbo data or work deeply in one US market. Choose Mashvisor if you compare short-term against long-term strategies in the US.
10. A Practical Acquisition Workflow
Integrating Airbtics into an acquisition pipeline works well as four stages:
- Macro market screening: identify cities with positive year-over-year revenue growth, stable regulation, and healthy tourism trends. Market Explorer’s AI recommendations help here, but remember the 5/month cap on Expert.
- Micro-market isolation: draw custom boundaries around high-performing corridors to filter out the surrounding underperformers.
- Compset benchmarking: analyze top listings inside your boundary to determine optimal bedroom layouts, occupancy benchmarks, and must-have amenities.
- Pro-forma modeling: run the target address through the calculator for net cash flow, cash-on-cash return, and debt coverage.
Following a structured protocol like this removes emotional bias from acquisition decisions - every property gets checked against historical market data before capital is committed.
11. Pros and Cons
Pros
- Flat-rate global access: one subscription covers every market worldwide, with no per-city unlock fees.
- Unlimited custom markets: freehand map boundaries on all paid plans, including the entry tier.
- Free calculator, no signup: verify the platform against a property you know before paying.
- Credible external validation: powers Awning’s Airbnb Estimator; Airbtics reports institutional users trading Airbnb stock.
- Steep annual discount: the site advertises up to 77% off versus monthly billing.
Cons
- Airbnb-only standard data: Vrbo, Booking.com, Expedia, and Agoda are enterprise-only, on request.
- No CSV export on Expert: market exports start on Scale, capped at 1,000 rows/month.
- Listing-level data costs extra: an add-on quoted at $150–$2,000 per market, outside any subscription.
- Uneven caps on the entry plan: Market Explorer is 5 searches/month and host intelligence 1 market/month, despite “unlimited” headline features.
- No free trial and limited support hours: support runs 8 AM–5 PM Singapore time, awkward for US and European users.
12. Frequently Asked Questions (FAQ)
What is Airbtics and how does it work?
Airbtics is a short-term rental analytics platform for real estate investors and hosts. It captures Airbnb listing calendars, rates, and review activity worldwide on a weekly cycle - Airbtics reports 20M+ listings across 54K+ markets - and applies machine-learning classifiers to separate paid bookings from owner-blocked nights, producing revenue estimates, occupancy rates, ADR, and ROI calculations.
Which booking platforms does Airbtics cover?
Airbnb only, for its standard property-level data. Airbtics states that scraping for Vrbo, Booking.com, Expedia, Agoda, and other OTAs "is available on request as part of selected enterprise solutions." If multi-platform data is essential, discuss an enterprise arrangement or consider AirDNA, which covers Airbnb and Vrbo as standard.
How accurate are Airbtics revenue projections?
Airbtics reports over 96% accuracy on its pricing FAQ and 97% data accuracy elsewhere on its site, including a stated 97% correlation with Airbnb's officially reported figures. These are vendor-reported figures, not an independent audit. Supporting signals include Airbtics' statement that its data is used by financial institutions trading Airbnb stock, and that Awning's public Airbnb Estimator is powered by Airbtics. Because the calculator is free, the best check is to run it on a property whose real numbers you already know.
Can I analyze custom neighborhood boundaries with Airbtics?
Yes, and it's unlimited on every paid plan. You can draw custom markets and submarkets around specific street blocks, beachfront corridors, or lakefront communities, and Airbtics recalculates median revenue, ADR, occupancy, and active listing counts for listings inside your boundary only.
How much does Airbtics cost?
In the US, Analytics Expert is $65/month or $195/year (about $16/month), and Market Intelligence Scale is $295/month or $750/year (about $63/month). Airbtics varies pricing by country and actively tests rates, so some regions see lower figures - around $39/month or $119/year. Check the price shown in your own region. Prices verified 10 August 2026.
Does Airbtics have a free trial?
There is no free trial on paid plans. However, the Airbnb revenue calculator is free and requires no signup - you can estimate revenue for any address worldwide before subscribing. Enterprise plans have a separate trial request process, and paid subscriptions can be cancelled any time, with access retained until the end of the billing period.
Does Airbtics offer data exports?
Partially, and this is the most commonly misunderstood limit. The Expert plan has no CSV export. Market Intelligence Scale adds exports of up to 1,000 rows per month covering saved markets, saved calculator reports, Market Explorer results, and management company lists. Individual listing-level data is not included in any subscription - it is a paid add-on that Airbtics quotes between $150 and $2,000 per market depending on granularity.
Where can I sign up for Airbtics?
You can create an account and access the global market database through the official platform at Airbtics. Start with the free calculator on an address you know well, then compare the Expert and Scale tiers against your export and listing-level data needs.
13. Final Verdict
Airbtics is a well-built short-term rental analytics platform with a genuinely differentiated commercial model. Flat-rate access to every market worldwide, combined with unlimited custom map boundaries on the entry plan, makes it the strongest value in the category for anyone researching more than one or two markets - particularly outside the US, where competitors’ per-market pricing compounds quickly.
The limits are real and worth weighing. Standard data covers Airbnb only, the entry plan has no CSV export, and raw listing-level data sits behind a separate add-on. If you need Vrbo coverage or heavy raw data access, price out Scale, the add-on, or AirDNA before committing.
For most individual investors, hosts, and arbitrage operators screening markets and modeling acquisitions, Airbtics does the job at a fraction of what per-market competitors charge. And because the calculator is free and needs no signup, you can test the data against a property you already know before spending anything - which is exactly how we’d recommend approaching it.
Final Rating: 4.7 / 5
Try Airbtics → | Compare alternatives →
Disclosure: This review may contain affiliate links. If you sign up through our link, we may earn a commission at no extra cost to you. This does not influence our ratings or editorial opinion.